

The alpha-galactomannan Davanat binds galectin-1 at a site different from the conventional galectin carbohydrate binding domain
- PMID: 19541770
- PMCID: PMC2720280
- DOI: 10.1093/glycob/cwp084
The alpha-galactomannan Davanat binds galectin-1 at a site different from the conventional galectin carbohydrate binding domain
Abstract
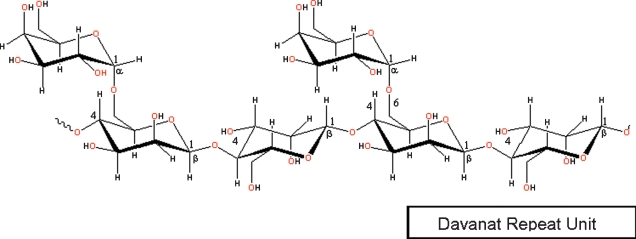
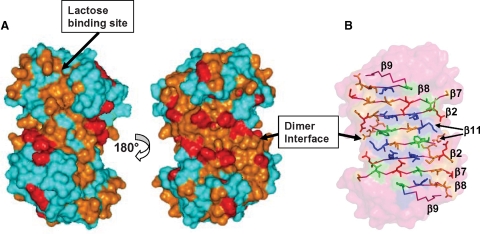
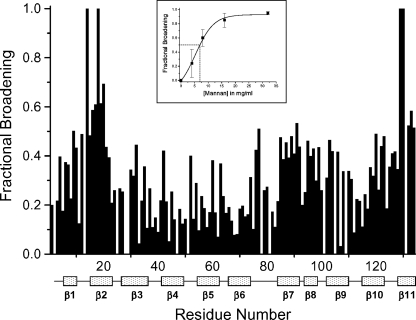
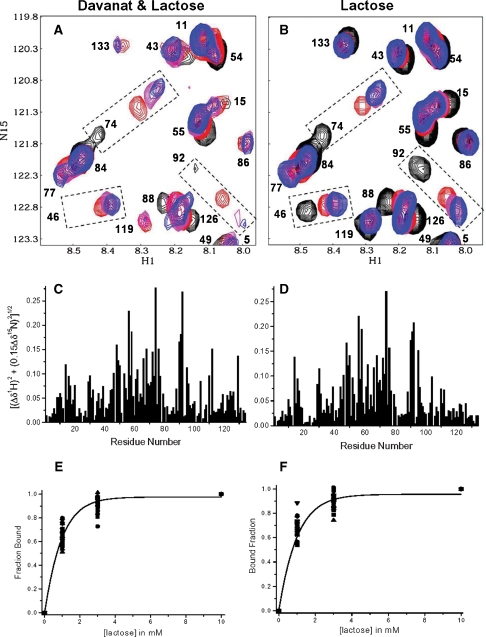
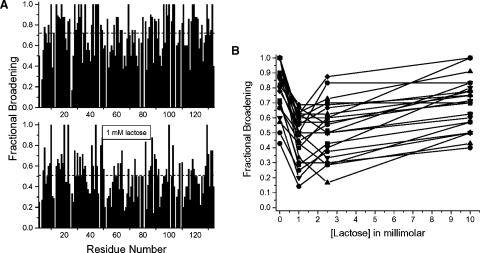
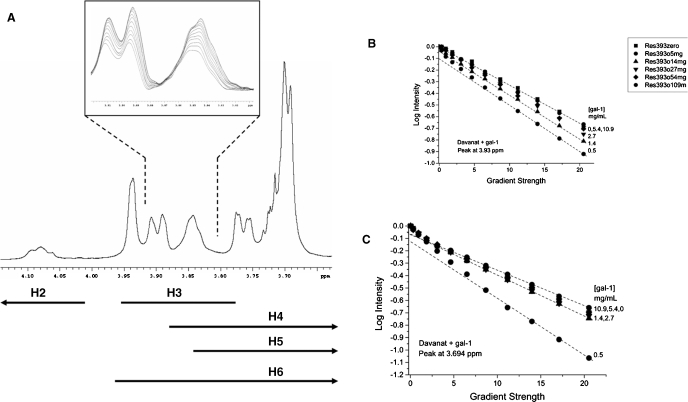
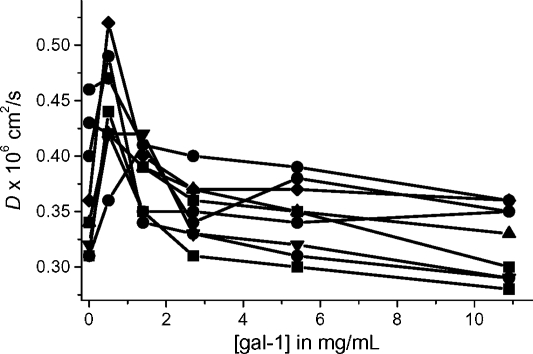
Galectins are a sub-family of lectins, defined by their highly conserved beta-sandwich structures and ability to bind to beta-galactosides, like Gal beta1-4 Glc (lactose). Here, we used (15)N-(1)H HSQC and pulse field gradient (PFG) NMR spectroscopy to demonstrate that galectin-1 (gal-1) binds to the relatively large galactomannan Davanat, whose backbone is composed of beta1-4-linked d-mannopyranosyl units to which single d-galactopyranosyl residues are periodically attached via alpha1-6 linkage (weight-average MW of 59 kDa). The Davanat binding domain covers a relatively large area on the surface of gal-1 that runs across the dimer interface primarily on that side of the protein opposite to the lactose binding site. Our data show that gal-1 binds Davanat with an apparent equilibrium dissociation constant (K(d)) of 10 x 10(-6) M, compared to 260 x 10(-6) M for lactose, and a stiochiometry of about 3 to 6 gal-1 molecules per Davanat molecule. Mannan also interacts at the same galactomannan binding domain on gal-1, but with at least 10-fold lower avidity, supporting the role of galactose units in Davanat for relatively strong binding to gal-1. We also found that the beta-galactoside binding domain remains accessible in the gal-1/Davanat complex, as lactose can still bind with no apparent loss in affinity. In addition, gal-1 binding to Davanat also modifies the supermolecular structure of the galactomannan and appears to reduce its hydrodynamic radius and disrupt inter-glycan interactions thereby reducing glycan-mediated solution viscosity. Overall, our findings contribute to understanding gal-1-carbohydrate interactions and provide insight into gal-1 function with potentially significant biological consequences.
Figures
Similar articles
-
The carbohydrate-binding domain on galectin-1 is more extensive for a complex glycan than for simple saccharides: implications for galectin-glycan interactions at the cell surface.Biochem J. 2009 Jun 26;421(2):211-21. doi: 10.1042/BJ20090265. Biochem J. 2009. PMID: 19432560 Free PMC article.
-
Structural features for α-galactomannan binding to galectin-1.Glycobiology. 2012 Apr;22(4):543-51. doi: 10.1093/glycob/cwr173. Epub 2011 Dec 7. Glycobiology. 2012. PMID: 22156919 Free PMC article.
-
Lactose binding to galectin-1 modulates structural dynamics, increases conformational entropy, and occurs with apparent negative cooperativity.J Mol Biol. 2010 Apr 16;397(5):1209-30. doi: 10.1016/j.jmb.2010.02.033. Epub 2010 Feb 23. J Mol Biol. 2010. PMID: 20184898
-
Oligosaccharide specificity of galectins: a search by frontal affinity chromatography.Biochim Biophys Acta. 2002 Sep 19;1572(2-3):232-54. doi: 10.1016/s0304-4165(02)00311-2. Biochim Biophys Acta. 2002. PMID: 12223272 Review.
-
Galectin 1 in dermatology: current knowledge and perspectives.Acta Dermatovenerol Alp Pannonica Adriat. 2019 Mar;28(1):27-31. Acta Dermatovenerol Alp Pannonica Adriat. 2019. PMID: 30901066 Review.
Cited by
-
Cysteine Oxidation in Human Galectin-1 Occurs Sequentially via a Folded Intermediate to a Fully Oxidized Unfolded Form.Int J Mol Sci. 2024 Jun 25;25(13):6956. doi: 10.3390/ijms25136956. Int J Mol Sci. 2024. PMID: 39000066 Free PMC article.
-
Galectin functions in cancer-associated inflammation and thrombosis.Front Cardiovasc Med. 2023 Feb 17;10:1052959. doi: 10.3389/fcvm.2023.1052959. eCollection 2023. Front Cardiovasc Med. 2023. PMID: 36873388 Free PMC article. Review.
-
Galectin-13, a different prototype galectin, does not bind β-galacto-sides and forms dimers via intermolecular disulfide bridges between Cys-136 and Cys-138.Sci Rep. 2018 Jan 17;8(1):980. doi: 10.1038/s41598-018-19465-0. Sci Rep. 2018. PMID: 29343868 Free PMC article.
-
Antitumor agent calixarene 0118 targets human galectin-1 as an allosteric inhibitor of carbohydrate binding.J Med Chem. 2012 Jun 14;55(11):5121-9. doi: 10.1021/jm300014q. Epub 2012 May 30. J Med Chem. 2012. PMID: 22575017 Free PMC article.
-
A DNA Aptamer Targeting Galectin-1 as a Novel Immunotherapeutic Strategy for Lung Cancer.Mol Ther Nucleic Acids. 2019 Dec 6;18:991-998. doi: 10.1016/j.omtn.2019.10.029. Epub 2019 Nov 2. Mol Ther Nucleic Acids. 2019. PMID: 31778957 Free PMC article.
References
-
- Appukuttan PS. Terminal α-linked galactose rather than N-acetyl lactosamine is ligand for bovine heart galectin-1 in N-linked oligosaccharides of glycoproteins. J Mol Recogn. 2002;15:180–187. - PubMed
-
- Appukuttan PS, Geetha M, Annamma KI. Anomer specificity of the 14 kDa galactose binding lectin, a reappraisal. J Biosci. 1995;20:377–384.
-
- Balcan E, Tuglu I, Sahin M, Toparlak P. Cell surface glycosylation diversity of embryonic thymic tissues. Acta Histochem. 2008;100:14–25. - PubMed
-
- Barondes SH, Castronovo V, Cooper DN, Cummings RD, Drickamer K, Feizi T, Gitt MA, Hirabayashi J, Hughes C, Kasai K, et al. Galectins: A family of animal β-galactoside-binding lectins. Cell. 1994;76:597–598. - PubMed
-
- Bourne Y, Bolgiano B, Liao DI, Strecker G, Cantau P, Herzberg O, Feizi T, Cambillau C. Crosslinking of mammalian lectin (galectin-1) by complex biantennary saccharides. Nat Struct Biol. 1994;1:863–870. - PubMed
Publication types
MeSH terms
Substances
Grants and funding
LinkOut - more resources
Full Text Sources
Research Materials
