

Fractional anisotropy--threshold dependence in tract-based diffusion tensor analysis: evaluation of the uncinate fasciculus in Alzheimer disease
- PMID: 19541775
- PMCID: PMC7051508
- DOI: 10.3174/ajnr.A1698
Fractional anisotropy--threshold dependence in tract-based diffusion tensor analysis: evaluation of the uncinate fasciculus in Alzheimer disease
Abstract
Background and purpose: Tract-based analysis can be used to investigate required tracts extracted from other fiber tracts. However, the fractional anisotropy (FA) threshold influences tractography analysis. The current study evaluated the influence of the FA threshold in measuring diffusion tensor parameters for tract-based analysis of the uncinate fasciculus in subjects with Alzheimer disease (AD).
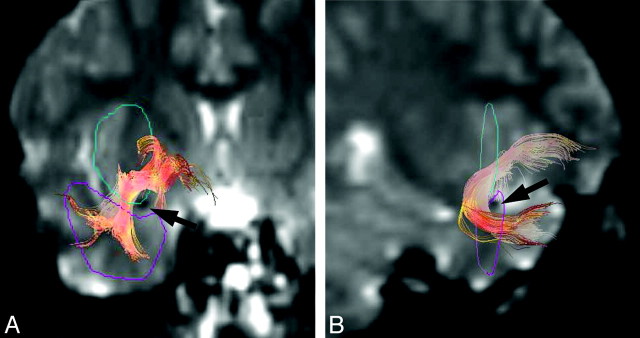
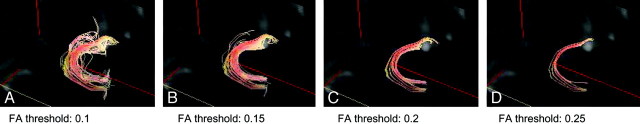
Materials and methods: Subjects included 30 patients with AD and 10 healthy controls. We acquired tractographies of the uncinate fasciculus by using different FA thresholds. We measured mean FA and the apparent diffusion coefficient (ADC) along the uncinate fasciculus for different FA thresholds and evaluated the correlation between diffusion tensor parameters (FA, ADC) and the Mini-Mental State Examination (MMSE) scores.
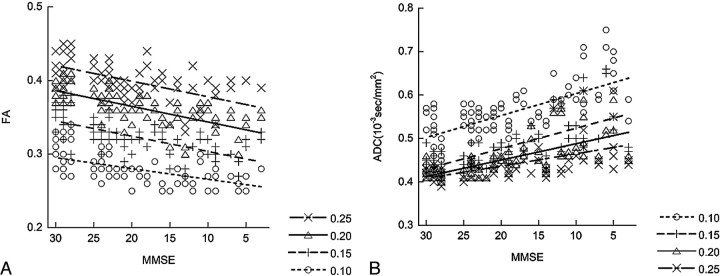
Results: The uncinate fasciculus showed lower mean FA and higher mean ADC values in cases with more severe AD. A higher FA threshold led to a lower mean ADC value and a higher mean FA value along the uncinate fasciculus, whereas the relative order of measured values according to the severity of AD was not influenced by the FA threshold. An FA threshold of 0.2 showed higher correlation between mean ADC values and MMSE scores. FA thresholds of 0.15 and 0.20 showed higher correlation between mean FA values and MMSE scores.
Conclusions: Appropriate selection of the FA threshold leads to higher correlation between diffusion tensor parameters and the severity of AD. For tract-based analysis of degenerative diseases such as AD, appropriate selection of the FA threshold for tractography is important.
Figures

Similar articles
-
Uncinate fasciculus-correlated cognition in Alzheimer's disease: a diffusion tensor imaging study by tractography.Psychogeriatrics. 2010 Mar;10(1):15-20. doi: 10.1111/j.1479-8301.2010.00312.x. Psychogeriatrics. 2010. PMID: 20594282
-
Diffusion tensor tractography of the uncinate fasciculus: pitfalls in quantitative analysis due to traumatic volume changes.J Magn Reson Imaging. 2013 Jul;38(1):46-53. doi: 10.1002/jmri.23901. Epub 2013 Jun 3. J Magn Reson Imaging. 2013. PMID: 23733545
-
Tract-specific analysis of white matter integrity disruption in schizophrenia.Psychiatry Res. 2012 Feb 28;201(2):136-43. doi: 10.1016/j.pscychresns.2011.07.010. Epub 2012 Mar 6. Psychiatry Res. 2012. PMID: 22398298
-
The role of diffusion tensor imaging and fractional anisotropy in the evaluation of patients with idiopathic normal pressure hydrocephalus: a literature review.Neurosurg Focus. 2016 Sep;41(3):E12. doi: 10.3171/2016.6.FOCUS16192. Neurosurg Focus. 2016. PMID: 27581308 Review.
-
Dissecting the uncinate fasciculus: disorders, controversies and a hypothesis.Brain. 2013 Jun;136(Pt 6):1692-707. doi: 10.1093/brain/awt094. Epub 2013 May 6. Brain. 2013. PMID: 23649697 Free PMC article. Review.
Cited by
-
Comparative neuroanatomy: Integrating classic and modern methods to understand association fibers connecting dorsal and ventral visual cortex.Neurosci Res. 2019 Sep;146:1-12. doi: 10.1016/j.neures.2018.10.011. Epub 2018 Oct 30. Neurosci Res. 2019. PMID: 30389574 Free PMC article. Review.
-
Reproducibility of diffusion tensor image analysis along the perivascular space (DTI-ALPS) for evaluating interstitial fluid diffusivity and glymphatic function: CHanges in Alps index on Multiple conditiON acquIsition eXperiment (CHAMONIX) study.Jpn J Radiol. 2022 Feb;40(2):147-158. doi: 10.1007/s11604-021-01187-5. Epub 2021 Aug 14. Jpn J Radiol. 2022. PMID: 34390452 Free PMC article.
-
"Cerebellar peduncle quarter notes" formed by the superior and middle cerebellar peduncles: comparison with a diffusion tensor study of spinocerebellar degeneration.Jpn J Radiol. 2015 Apr;33(4):210-5. doi: 10.1007/s11604-015-0409-2. Epub 2015 Mar 7. Jpn J Radiol. 2015. PMID: 25749832
-
Pathways explaining racial/ethnic and socio-economic disparities in brain white matter integrity outcomes in the UK Biobank study.SSM Popul Health. 2024 Mar 20;26:101655. doi: 10.1016/j.ssmph.2024.101655. eCollection 2024 Jun. SSM Popul Health. 2024. PMID: 38562403 Free PMC article.
-
Tract-specific analysis for investigation of Alzheimer disease: a brief review.Jpn J Radiol. 2010 Aug;28(7):494-501. doi: 10.1007/s11604-010-0460-y. Epub 2010 Aug 27. Jpn J Radiol. 2010. PMID: 20799014 Review.
References
-
- Taoka T, Kin T, Nakagawa H, et al. Diffusivity and diffusion anisotropy of cerebellar peduncles in cases of spinocerebellar degenerative disease. Neuroimage 2007;37:387–93 - PubMed
-
- Kunimatsu N, Aoki S, Kunimatsu A, et al. Tract-specific analysis of the superior occipitofrontal fasciculus in schizophrenia. Psychiatry Res 2008;164:198–205 - PubMed
-
- Yasmin H, Nakata Y, Aoki S, et al. Diffusion abnormalities of the uncinate fasciculus in Alzheimer's disease: diffusion tensor tract-specific analysis using a new method to measure the core of the tract. Neuroradiology 2008;50:293–99 - PubMed
MeSH terms
LinkOut - more resources
Full Text Sources
Medical