

Long-term exposure to zidovudine delays cell cycle progression, induces apoptosis, and decreases telomerase activity in human hepatocytes
- PMID: 19541796
- PMCID: PMC2734309
- DOI: 10.1093/toxsci/kfp136
Long-term exposure to zidovudine delays cell cycle progression, induces apoptosis, and decreases telomerase activity in human hepatocytes
Abstract
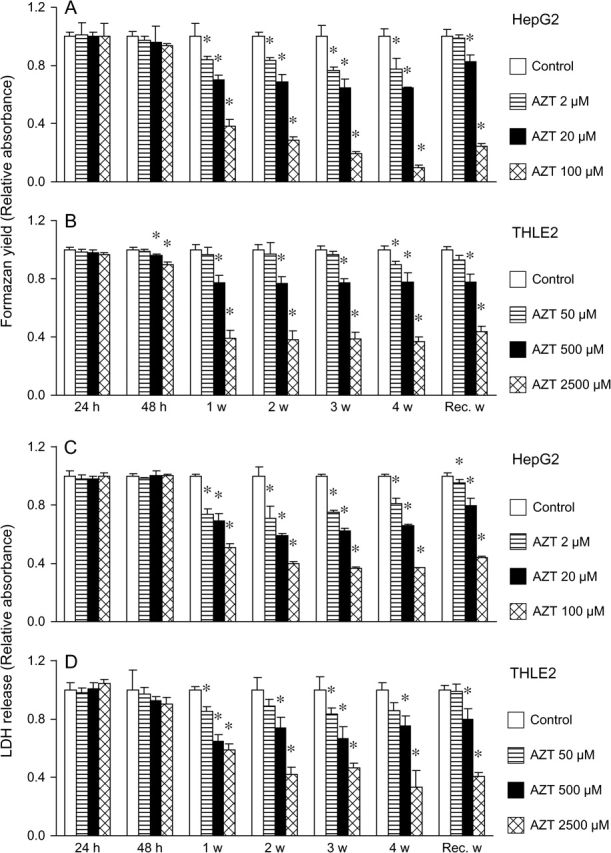
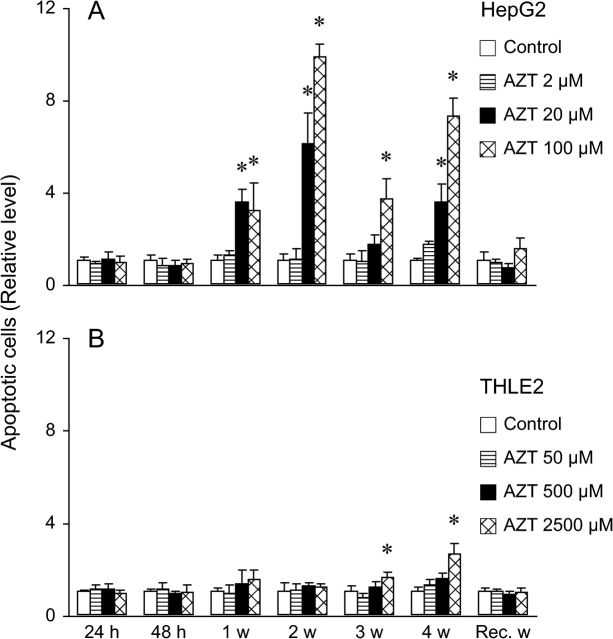
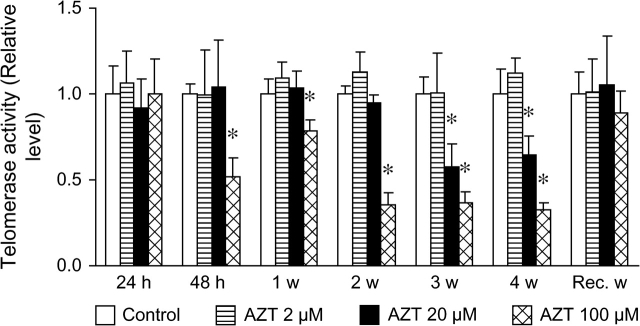
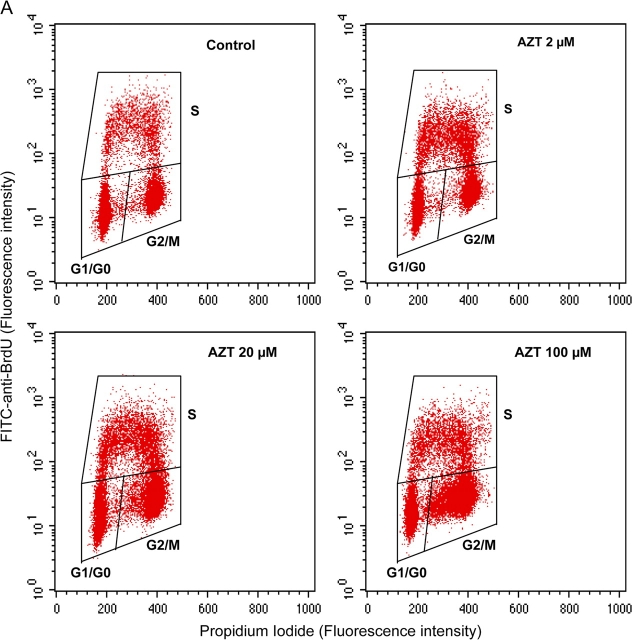
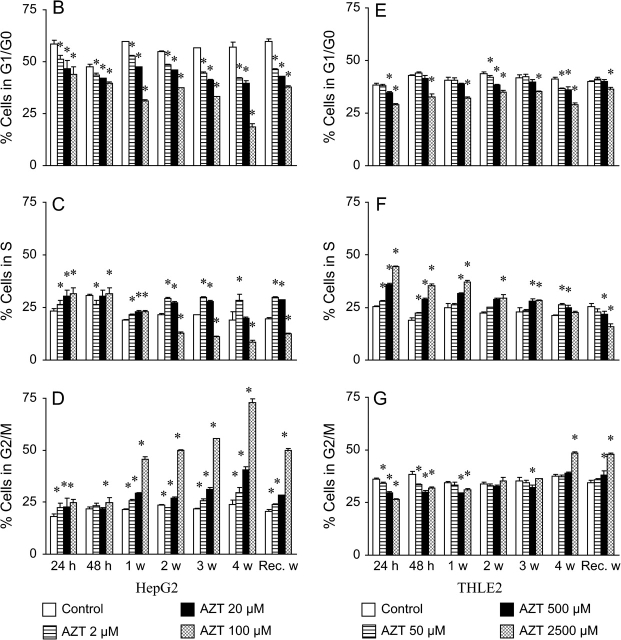
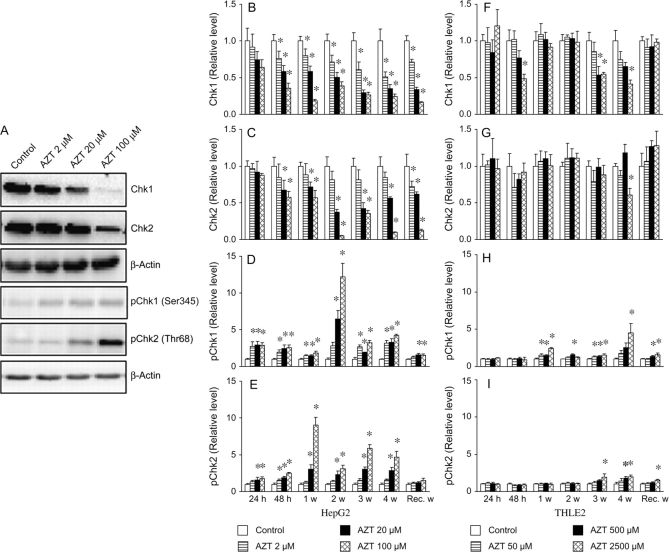
Zidovudine (3'-azido-3'-deoxythymidine; AZT), which is currently used in the treatment of acquired immunodeficiency syndrome, has been shown to have anticancer properties. In the present study, we examined the mechanisms contributing to increased sensitivity of cancer cells to the growth-inhibitory effects of AZT. This was accomplished by incubating a hepatoma cell line (HepG2) and a normal liver cell line (THLE2) with AZT in continuous culture for up to 4 weeks and evaluating the number of viable and necrotic cells, the induction of apoptosis, cell cycle alterations, and telomerase activity. In HepG2 cells, AZT (2-100 microM) caused significant dose-dependent decreases in the number of viable cells at exposures > 24 h. During a 1-week recover period, there was only a slight increase in the number of viable cells treated with AZT. The decrease in viable cells was associated with an induction of apoptosis, a decrease in telomerase activity, and S and G2/M phase arrest of the cell cycle. During the recovery period, the extent of apoptosis and telomerase activity returned to control levels, whereas the disruption of cell cycle progression persisted. Western blot analysis indicated that AZT caused a decrease in checkpoint kinase 1 (Chk1) and kinase 2 (Chk2) and an increase in phosphorylated Chk1 (Ser345) and Chk2 (Thr68). Similar effects, to lesser extent, were observed in THLE2 cells given much higher concentrations of AZT (50-2500 microM). These data show that HepG2 cells are much more sensitive than THLE2 cells to AZT. They also indicate that a combination of a delay of cell cycle progression, an induction of apoptosis, and a decrease in telomerase activity is contributing to the decrease in the number of viable cells from AZT treatment, and that checkpoint enzymes Chk1 and Chk2 may play an important role in the delay of cell cycle progression.
Figures
Similar articles
-
Interference of cell cycle progression by zidovudine and lamivudine in NIH 3T3 cells.Mutagenesis. 2009 Mar;24(2):133-41. doi: 10.1093/mutage/gen059. Epub 2008 Oct 20. Mutagenesis. 2009. PMID: 18936108 Free PMC article.
-
Differential gene expression in human hepatocyte cell lines exposed to the antiretroviral agent zidovudine.Arch Toxicol. 2014 Mar;88(3):609-23. doi: 10.1007/s00204-013-1169-3. Epub 2013 Nov 30. Arch Toxicol. 2014. PMID: 24292225 Free PMC article.
-
[Effects of AZT on leukemia cell line KG-1a proliferation and telomerase activity].Zhongguo Shi Yan Xue Ye Xue Za Zhi. 2012 Apr;20(2):277-81. Zhongguo Shi Yan Xue Ye Xue Za Zhi. 2012. PMID: 22541081 Chinese.
-
Synergic effect of 3'-azido-3'-deoxythymidine and arsenic trioxide in suppressing hepatoma cells.Anticancer Drugs. 2011 Jun;22(5):435-43. doi: 10.1097/CAD.0b013e328340ca08. Anticancer Drugs. 2011. PMID: 21502917
-
Mechanisms of genotoxicity of nucleoside reverse transcriptase inhibitors.Environ Mol Mutagen. 2007 Apr-May;48(3-4):215-23. doi: 10.1002/em.20195. Environ Mol Mutagen. 2007. PMID: 16395695 Review.
Cited by
-
In vitro characterization and rational analog design of a novel inhibitor of telomerase assembly in MDA MB 231 breast cancer cell line.Oncol Rep. 2022 Nov;48(5):188. doi: 10.3892/or.2022.8403. Epub 2022 Sep 14. Oncol Rep. 2022. PMID: 36102322 Free PMC article.
-
Roles of ROS and cell cycle arrest in the genotoxicity induced by gold nanorod core/silver shell nanostructure.Nanoscale Res Lett. 2020 Dec 7;15(1):224. doi: 10.1186/s11671-020-03455-1. Nanoscale Res Lett. 2020. PMID: 33284367 Free PMC article.
-
Acrolein enhances epigenetic modifications, FasL expression and hepatocyte toxicity induced by anti-HIV drug Zidovudine.Toxicol In Vitro. 2016 Sep;35:66-76. doi: 10.1016/j.tiv.2016.05.013. Epub 2016 May 26. Toxicol In Vitro. 2016. PMID: 27238871 Free PMC article.
-
Apoptosis of Hepatocytes: Relevance for HIV-Infected Patients under Treatment.Cells. 2021 Feb 16;10(2):410. doi: 10.3390/cells10020410. Cells. 2021. PMID: 33669403 Free PMC article. Review.
-
Cytotoxicity of Iron (III), Molybdenum (III), and their Mixtures in BALB/3T3 and HepG2 Cells.J Vet Res. 2018 Dec 31;62(4):527-533. doi: 10.2478/jvetres-2018-0066. eCollection 2018 Dec. J Vet Res. 2018. PMID: 30729212 Free PMC article.
References
-
- American Hospital Formulary Service. Nucleoside and Nucleotide Reverse Transcriptase Inhibitors, Zidovudine. In American Hospital Formulary Service Drug Information 8.18.08.20 (G. K. McEvoy, Ed.) Bethesda, MD: American Society of Health-System Pharmacists, Inc; 2007.
-
- Allen M, Millett P, Dawes E, Rushton N. Lactate dehydrogenase activity as a rapid and sensitive test for the quantification of cell numbers in vitro. Clin. Mater. 1994;16:189–194. - PubMed
-
- Andreuccetti M, Allegrini G, Antonuzzo A, Malvaldi G, Conte PF, Danesi R, Del Tacca M, Falcone A. Azidothymidine in combination with 5-fluorouracil in human colorectal cell lines: In vitro synergistic cytotoxicity and DNA-induced strand-breaks. Eur. J. Cancer. 1996;32A:1219–1226. - PubMed
-
- Brinkman K, Kakuda TN. Mitochondrial toxicity of nucleoside analogue reverse transcriptase inhibitors: A looming obstacle for long-term antiretroviral therapy? Curr. Opin. Infect. Dis. 2000;13:5–11. - PubMed
Publication types
MeSH terms
Substances
LinkOut - more resources
Full Text Sources
Medical
Molecular Biology Databases
Miscellaneous
