

Establishment of histone modifications after chromatin assembly
- PMID: 19541851
- PMCID: PMC2731903
- DOI: 10.1093/nar/gkp518
Establishment of histone modifications after chromatin assembly
Abstract
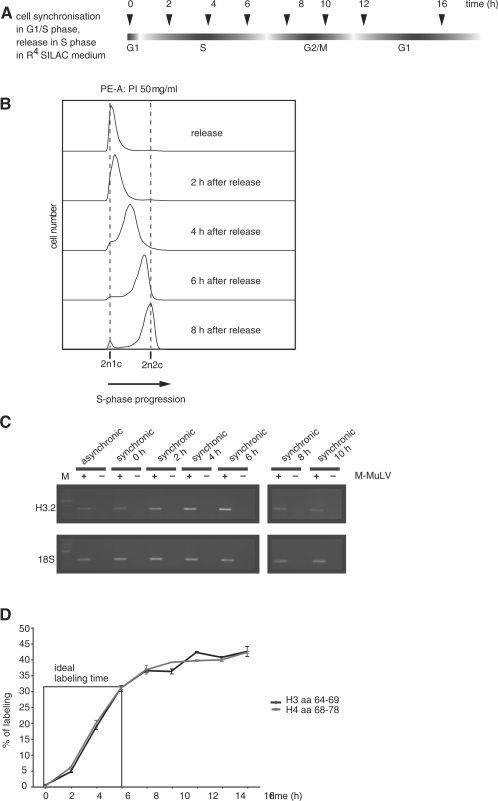
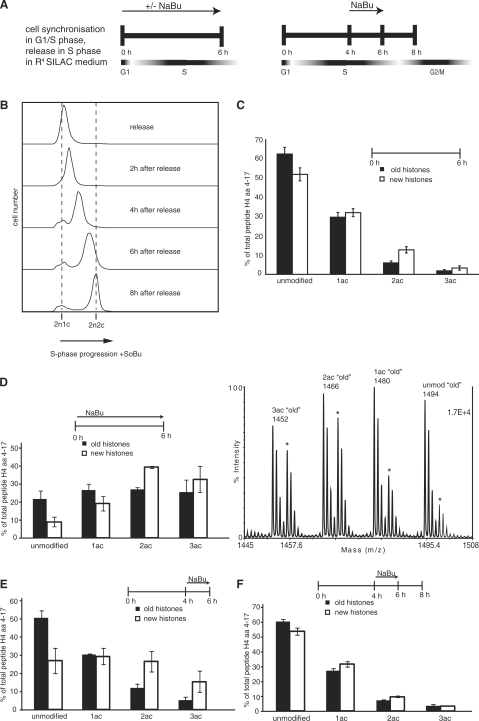
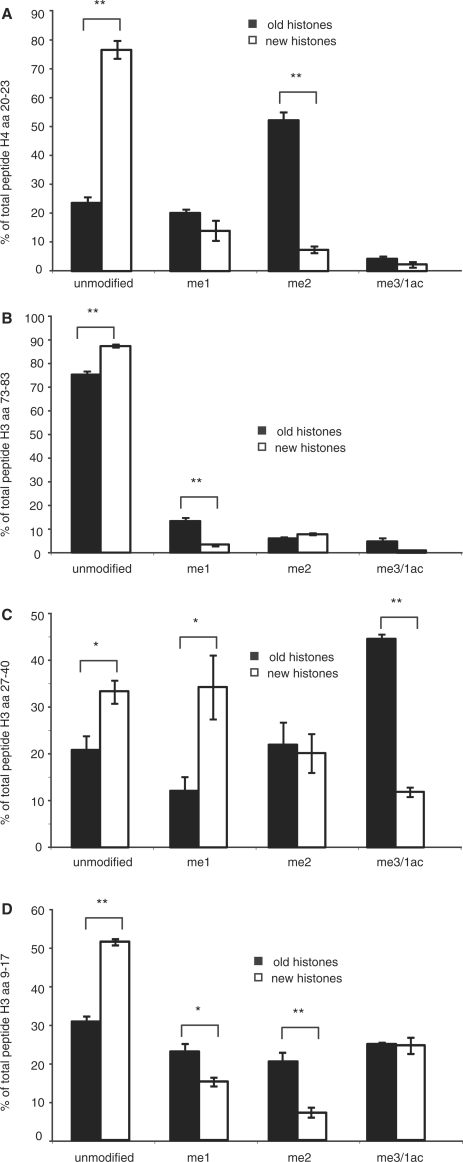
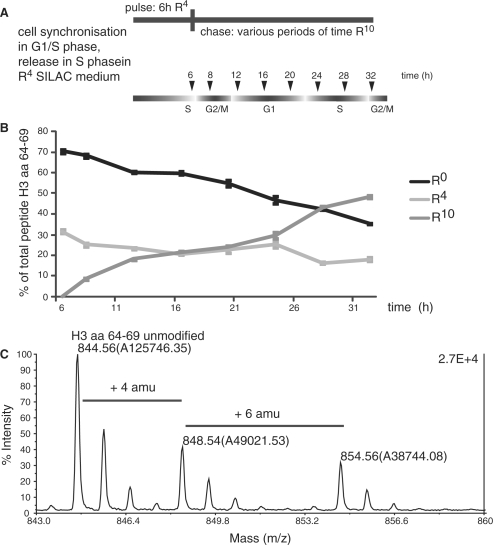
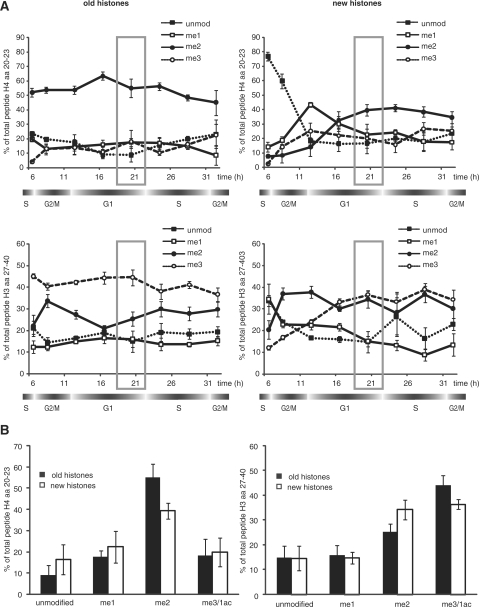
Every cell has to duplicate its entire genome during S-phase of the cell cycle. After replication, the newly synthesized DNA is rapidly assembled into chromatin. The newly assembled chromatin 'matures' and adopts a variety of different conformations. This differential packaging of DNA plays an important role for the maintenance of gene expression patterns and has to be reliably copied in each cell division. Posttranslational histone modifications are prime candidates for the regulation of the chromatin structure. In order to understand the maintenance of chromatin structures, it is crucial to understand the replication of histone modification patterns. To study the kinetics of histone modifications in vivo, we have pulse-labeled synchronized cells with an isotopically labeled arginine ((15)N(4)) that is 4 Da heavier than the naturally occurring (14)N(4) isoform. As most of the histone synthesis is coupled with replication, the cells were arrested at the G1/S boundary, released into S-phase and simultaneously incubated in the medium containing heavy arginine, thus labeling all newly synthesized proteins. This method allows a comparison of modification patterns on parental versus newly deposited histones. Experiments using various pulse/chase times show that particular modifications have considerably different kinetics until they have acquired a modification pattern indistinguishable from the parental histones.
Figures
Similar articles
-
Relationship between methylation and acetylation of arginine-rich histones in cycling and arrested HeLa cells.Biochemistry. 1995 Mar 7;34(9):2916-24. doi: 10.1021/bi00009a023. Biochemistry. 1995. PMID: 7893706
-
Accurate Recycling of Parental Histones Reproduces the Histone Modification Landscape during DNA Replication.Mol Cell. 2018 Oct 18;72(2):239-249.e5. doi: 10.1016/j.molcel.2018.08.010. Epub 2018 Aug 23. Mol Cell. 2018. PMID: 30146316 Free PMC article.
-
Modifications of H3 and H4 during chromatin replication, nucleosome assembly, and histone exchange.J Biol Chem. 2006 Apr 7;281(14):9287-96. doi: 10.1074/jbc.M512956200. Epub 2006 Feb 7. J Biol Chem. 2006. PMID: 16464854
-
Histone lysine methylation and chromatin replication.Biochim Biophys Acta. 2014 Dec;1839(12):1433-9. doi: 10.1016/j.bbagrm.2014.03.009. Epub 2014 Mar 28. Biochim Biophys Acta. 2014. PMID: 24686120 Review.
-
Chromosomal histone modification patterns--from conservation to diversity.Trends Plant Sci. 2006 Apr;11(4):199-208. doi: 10.1016/j.tplants.2006.02.008. Epub 2006 Mar 20. Trends Plant Sci. 2006. PMID: 16546438 Review.
Cited by
-
Capturing the dynamic epigenome.Genome Biol. 2010;11(10):218. doi: 10.1186/gb-2010-11-10-218. Epub 2010 Oct 8. Genome Biol. 2010. PMID: 20959022 Free PMC article. Review.
-
Histone H2A.Z inheritance during the cell cycle and its impact on promoter organization and dynamics.Nat Struct Mol Biol. 2012 Nov;19(11):1076-83. doi: 10.1038/nsmb.2424. Epub 2012 Oct 21. Nat Struct Mol Biol. 2012. PMID: 23085713
-
In vivo residue-specific histone methylation dynamics.J Biol Chem. 2010 Jan 29;285(5):3341-50. doi: 10.1074/jbc.M109.063784. Epub 2009 Nov 23. J Biol Chem. 2010. PMID: 19940157 Free PMC article.
-
A model for mitotic inheritance of histone lysine methylation.EMBO Rep. 2011 Dec 23;13(1):60-7. doi: 10.1038/embor.2011.206. EMBO Rep. 2011. PMID: 22056817 Free PMC article.
-
Understanding HAT1: A Comprehensive Review of Noncanonical Roles and Connection with Disease.Genes (Basel). 2023 Apr 14;14(4):915. doi: 10.3390/genes14040915. Genes (Basel). 2023. PMID: 37107673 Free PMC article. Review.
References
-
- Bernstein BE, Mikkelsen TS, Xie X, Kamal M, Huebert DJ, Cuff J, Fry B, Meissner A, Wernig M, Plath K, et al. A bivalent chromatin structure marks key developmental genes in embryonic stem cells. Cell. 2006;125:315–326. - PubMed
-
- Narita M, Nunez S, Heard E, Lin AW, Hearn SA, Spector DL, Hannon GJ, Lowe SW. Rb-mediated heterochromatin formation and silencing of E2F target genes during cellular senescence. Cell. 2003;113:703–716. - PubMed
-
- Turner BM. Histone acetylation and an epigenetic code. BioEssays. 2000;22:836–845. - PubMed
-
- Jenuwein T, Allis CD. Translating the histone code. Science. 2001;293:1074–1080. - PubMed
Publication types
MeSH terms
Substances
LinkOut - more resources
Full Text Sources
Molecular Biology Databases
Research Materials
