. 2009 Jul;175(1):283-93.
doi: 10.2353/ajpath.2009.080807. Epub 2009 Jun 18.

Up-regulation of soluble Axl and Mer receptor tyrosine kinases negatively correlates with Gas6 in established multiple sclerosis lesions

Affiliations

Up-regulation of soluble Axl and Mer receptor tyrosine kinases negatively correlates with Gas6 in established multiple sclerosis lesions

Jason G Weinger et al. Am J Pathol. 2009 Jul.

Abstract

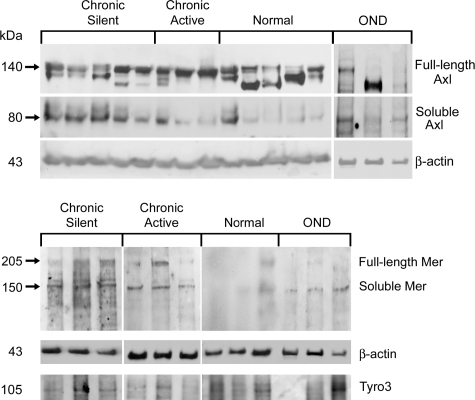
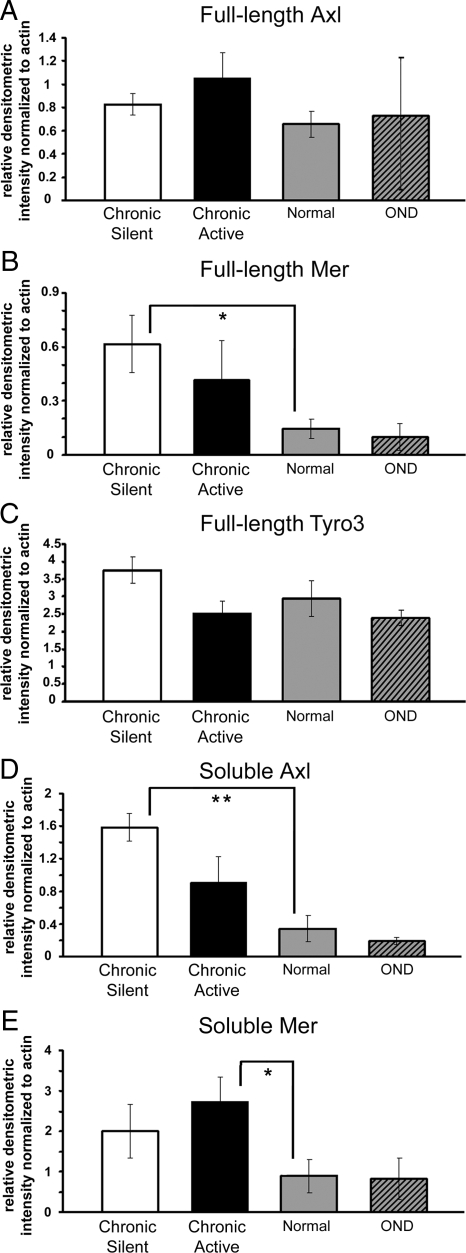
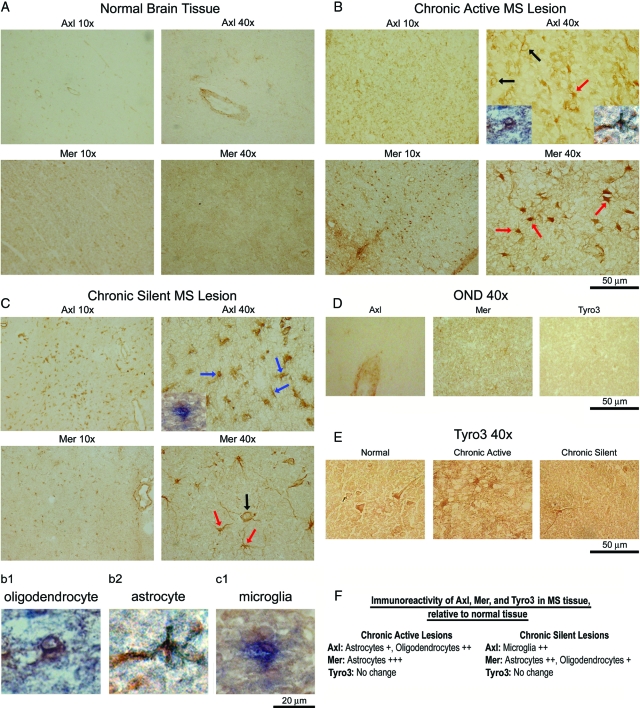
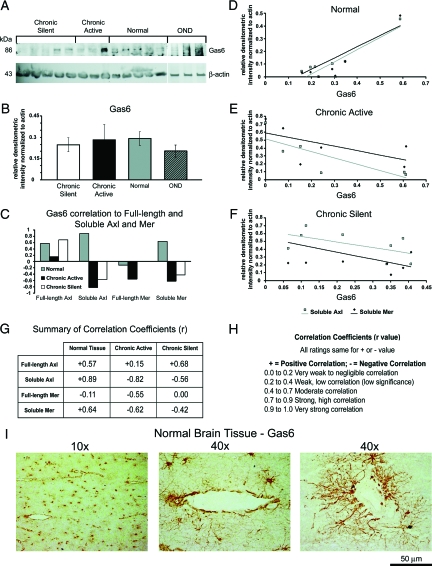
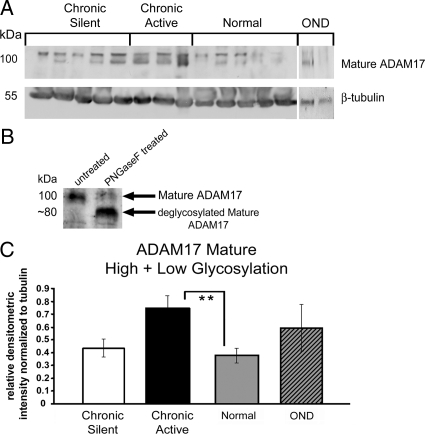
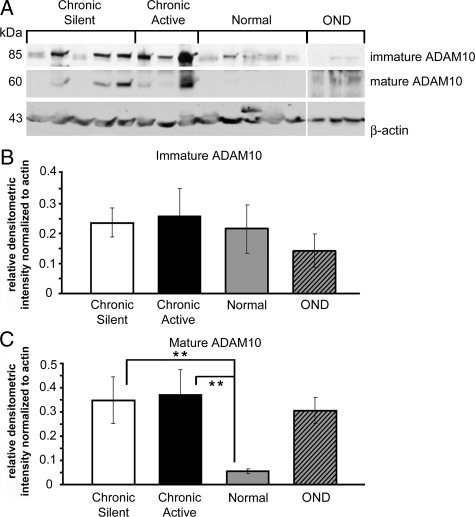
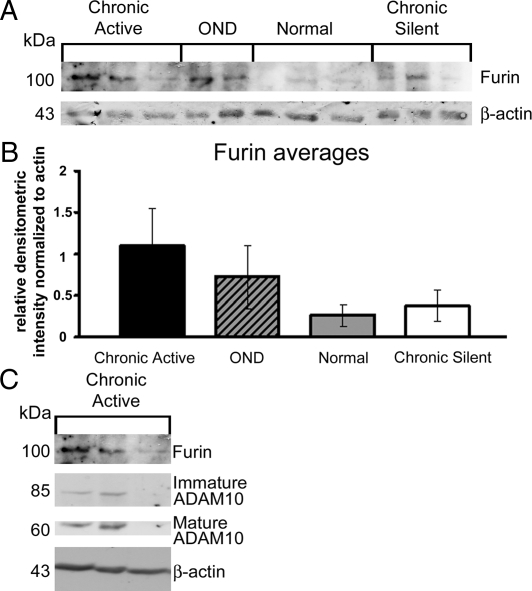
Multiple sclerosis is a disease that is characterized by inflammation, demyelination, and axonal damage; it ultimately forms gliotic scars and lesions that severely compromise the function of the central nervous system. Evidence has shown previously that altered growth factor receptor signaling contributes to lesion formation, impedes recovery, and plays a role in disease progression. Growth arrest-specific protein 6 (Gas6), the ligand for the TAM receptor tyrosine kinase family, consisting of Tyro3, Axl, and Mer, is important for cell growth, survival, and clearance of debris. In this study, we show that levels of membrane-bound Mer (205 kd), soluble Mer ( approximately 150 kd), and soluble Axl (80 kd) were all significantly elevated in homogenates from established multiple sclerosis lesions comprised of both chronic active and chronic silent lesions. Whereas in normal tissue Gas6 positively correlated with soluble Axl and Mer, there was a negative correlation between Gas6 and soluble Axl and Mer in established multiple sclerosis lesions. In addition, increased levels of soluble Axl and Mer were associated with increased levels of mature ADAM17, mature ADAM10, and Furin, proteins that are associated with Axl and Mer solubilization. Soluble Axl and Mer are both known to act as decoy receptors and block Gas6 binding to membrane-bound receptors. These data suggest that in multiple sclerosis lesions, dysregulation of protective Gas6 receptor signaling may prolong lesion activity.


Figures

Figure 1
Figure 1
Full-length and soluble Axl, Mer, and Tyro3 expression in brain tissue homogenates. Western blot analysis was performed using Axl, Mer, and Tyro3 mAbs on 80 μg of chronic active, OND, normal, and chronic silent brain tissue homogenates. The Axl and Mer mAb’s bind full-length and soluble forms of Axl and Mer, respectively. Six to eight samples were tested for each group except OND, where n = 3 for all antibodies tested except Tyro3 (n = 2). β-Actin was used as a loading control.
Figure 2
Figure 2
Relative to normal homogenates, soluble Axl is significantly increased in chronic silent tissue homogenates, soluble Mer is significantly increased in chronic active, and full-length Mer is significantly increased in chronic silent tissue homogenates. A–E: The relative densitometric intensity was determined for each band and normalized to β-actin. Average values for full-length Axl (A), Mer (B), and Tyro3 (C), and average values for soluble Axl (D) and Mer (E) in chronic active, OND, normal, and chronic silent brain tissue homogenates are shown. Significance was tested by Student’s t-test between chronic active or chronic silent, and normal tissue homogenates; *P < 0.05, **P < 0.01.
Figure 3
Figure 3
Altered Axl and Mer immunoreactivity in sections of chronic active and chronic silent MS lesions. Ten-micrometer frozen sections were stained with Axl, Mer and Tyro3 (E) mAbs. Staining of normal brain (A), chronic active (B), chronic silent (C) MS lesions, and OND (D) samples were visualized by DAB. Representative 10X and 40X images are shown. Magnification, 50-μm bar = ×40. Red arrows point to astrocytes (B and C), blue arrows to microglia (C), and black arrows to oligodendrocytes (B and C). To verify cell morphology, double-label immunohistochemistry was performed with an Axl mAb using a biotinylated secondary antibody with DAB and a PDGFRα pAb for oligodendrocytes (B, chronic active Axl 40X, left inset, and b1), glial fibrillary acidic protein pAb for astrocytes (B, chronic active Axl 40X, right inset, and b2), or Iba-1 pAb for microglia (C, chronic silent Axl 40X, left inset, and c1) using an AP secondary antibody with BCIP/NB-AP. The b1, b2, and c1 insets are enlarged to better show overlapping co-staining of DAB and AP. F: Axl and Mer were semiquantitatively evaluated in chronic active and chronic silent lesions and were scored relative to expression of each receptor in normal brain tissue on a 1–3+ scale. Moderate increase was rated +, high increase was rated ++, and very high increase was rated +++.
Figure 4
Figure 4
Negative correlation coefficients between Gas6 expression relative to soluble Axl and Mer in chronic active and chronic silent tissue homogenates. A: Blots containing 80 μg of chronic active, OND, normal, and chronic silent brain tissue homogenates were incubated with a Gas6 pAb. β-Actin was used as a loading control. B: The relative densitometric intensity was determined for each band normalized to β-actin and the average value for Gas6 in chronic active, OND, normal, and chronic silent brain tissue homogenates are shown. C: Correlation coefficients (r) were calculated between Gas6 and full-length and soluble Axl and Mer in normal, chronic active, and chronic silent brain tissue homogenates. D–F: Relative densitometric intensity for soluble Axl and Mer were graphed versus relative densitometric intensity for Gas6 for normal (D), chronic active (E), and chronic silent (F). Values for soluble Axl and Mer were normalized to use a linear scale for the x axis. A positive slope of the trend line indicates a positive correlation and a negative slope indicates a negative correlation with Gas6. G: Summary of correlation coefficients. H: Ratings of correlation coefficient values on scale from −1 to +1 based on a modification of the Cohen scale for interpreting correlation coefficients. I: Ten-micrometer frozen normal white matter brain tissue sections are stained with Gas6 pAb and visualized by DAB. Representative 10X and 40X images are shown. Left 40X image is high magnification of 10X image and right 40X image is from another normal brain tissue section. Magnification, 50-μm bar = ×40.
Figure 5
Figure 5
Relative to normal homogenates, mature ADAM17 is increased in chronic active tissue homogenates. A: Western blot analysis was performed using an ADAM17 pAb on 80 μg of chronic active, OND, normal, and chronic silent brain tissue homogenates. β-Actin was used as a load control. The ADAM17 pAb binds all forms of ADAM17. B: Before loading samples on gel, a normal brain homogenate sample (40 μg) was untreated (left lane) or treated with PNGaseF at 37°C for 3 hours. All other conditions were the same. The protein homogenates were analyzed by Western blot for glycosylation variants of mature ADAM17, using the ADAM17 pAb as in A. C: The relative densitometric intensity was determined for each band and normalized to β-actin. Data for the average values for mature ADAM17 (C) in chronic active, OND, normal, and chronic silent brain tissue homogenates are shown. Significance was tested between chronic active or chronic silent, and normal tissue homogenates; **P < 0.01.
Figure 6
Figure 6
Mature ADAM10 is increased in chronic active and chronic silent tissue homogenates relative to normal. A: Western blot analysis was performed using an ADAM10 pAb on 80 μg of chronic active, OND, normal, and chronic silent brain tissue homogenates. Three samples were tested for each group. β-Actin was used as a loading control. The ADAM10 pAb binds immature and mature forms of ADAM10. The relative densitometric intensity was determined for each band and normalized to β-actin. B and C: The average values for immature ADAM10 (B) and mature ADAM10 (C) in chronic active, OND, normal, and chronic silent brain tissue homogenates are shown; **P < 0.01. Different enhanced chemiluminescence exposure times are shown for immature and mature ADAM10 to best represent the data.
Figure 7
Figure 7
Increased Furin is detected in two of three chronic active homogenates relative to normal. A: Western blot analysis of chronic active, OND, normal, and chronic silent brain tissue homogenates was performed using a Furin. B and C: The relative densitometric intensity was determined for each band and normalized to β-actin. relative densitometric intensity data for the averages of Furin are shown in B. Corresponding chronic active samples stained with Furin, immature ADAM10 and mature ADAM10 are shown in C (n = 3 for all groups except OND for Furin, where n = 2).

References

    1. Sospedra M, Martin R. Immunology of multiple sclerosis. Annu Rev Immunol. 2005;23:683–747. - PubMed
    1. Noseworthy JH, Lucchinetti C, Rodriguez M, Weinshenker BG. Multiple sclerosis. N Engl J Med. 2000;343:938–952. - PubMed
    1. Fontoura P, Steinman L, Miller A. Emerging therapeutic targets in multiple sclerosis. Curr Opin Neurol. 2006;19:260–266. - PubMed
    1. Frohman EM, Racke MK, Raine CS. Multiple sclerosis–the plaque and its pathogenesis. N Engl J Med. 2006;354:942–955. - PubMed
    1. Raine CS. The Norton Lecture: a review of the oligodendrocyte in the multiple sclerosis lesion. J Neuroimmunol. 1997;77:135–152. - PubMed

Publication types

MeSH terms