. 2009 Jul;175(1):148-60.
doi: 10.2353/ajpath.2009.080837. Epub 2009 Jun 18.

Modulation of TGFbeta1-dependent myofibroblast differentiation by hyaluronan

Affiliations

Modulation of TGFbeta1-dependent myofibroblast differentiation by hyaluronan

Jason Webber et al. Am J Pathol. 2009 Jul.

Abstract

Myofibroblasts are contractile cells that are characterized by the expression of alpha-smooth muscle actin and mediate the closure of wounds and the formation of collagen-rich scars. Their presence in organs such as lungs, liver, and kidney has long been established as a marker of progressive fibrosis. The transforming growth factor beta(1)-driven differentiation of fibroblasts is a major source of myofibroblasts, and recent data have shown that hyaluronan is a major modulator of this process. This study examines this differentiation mechanism in more detail. Transforming growth factor beta(1)-dependent differentiation to the myofibroblastic phenotype was antagonized by the inhibition of hyaluronan synthesis, confirming that hyaluronan was necessary for differentiation. This response, however, was not reproduced by simply adding hyaluronan to fibroblasts, as the results implicated hyaladherins, as well as the macromolecular assembly of de novo hyaluronan, as essential in this process. We previously suggested that there is a relocalization of lipid-raft components during myofibroblastic differentiation. The present study demonstrates that the hyaluronan receptor CD44, the hyaluronidase HYAL 2, and the transforming growth factor beta(1)-receptor ALK5 all relocalized from raft to non-raft locations, which was reversed by the addition of exogenous hyaluronan. These data highlight a role for endogenous hyaluronan in the mediation of myofibroblastic differentiation. While hyaluronan synthesis was both essential and necessary for differentiation, exogenously provided hyaluronan antagonized differentiation, underscoring a pathological role for hyaluronan in such cell fate processes.


Figures
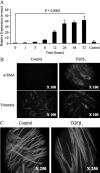
Figure 1
Figure 1
Induction of the myofibroblast phenotype. Fibroblasts were grown to near confluency and then growth-arrested for 48 hours in serum-free medium. Medium was aspirated and replaced either with fresh serum-free medium (control) or serum-free medium containing 10 ng/ml TGFβ1 for times up to 72 hours. A: mRNA was extracted as described in Materials and Methods and α-SMA expression quantified by QPCR. Ribosomal RNA expression was used as an endogenous control and gene expression was assayed relative to control samples. The comparative CT method was used for relative quantification of gene expression, as described in Materials and Methods and the results are expressed as the mean ± SEM of four independent experiments. Statistical analysis was performed using the paired Student’s t-test and statistical significance was taken as P < 0.05. B: Cells were fixed after 72 hours as described and immunostained for vimentin or α-SMA. Results are representative of four individual experiments. C: Cells fixed after 72 hours were permeabilized in 0.1% (v/v) Tween-20 in PBS and then stained for F-actin with fluorescein isothiocyanate-phalloidin as described. Results are representative of four individual experiments.
Figure 2
Figure 2
Myofibroblastic induction is dependent on Smad-related TGFβ signaling. Fibroblasts were transfected with siRNA specific to Smad2, Smad3, or a scrambled control for 48 hours in serum-free medium. The medium was changed and the cells stimulated with TGFβ1 (10 ng/ml) for a further 72 hours. mRNA was extracted as described in Materials and Methods. Following transfection with Smad 2-specific siRNA (A and B) or Smad 3-specific siRNA (C and D), the expression of Smad 2 (A), Smad 3 (C), and α-SMA (B and D) were quantified by QPCR. Ribosomal RNA expression was used as an endogenous control and gene expression was assayed relative to control samples. The comparative CT method was used for relative quantification of gene expression and the results are expressed as the mean ± SEM of four independent experiments. Statistical analysis was performed using the one-way analysis of variance test (P < 0.001) followed by Tukey’s HSD posthoc test and statistical significance was taken as P < 0.05.
Figure 3
Figure 3
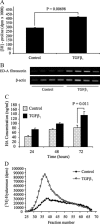
Phenotype-specific changes in extracellular matrix components. Fibroblasts were grown to near confluency and then growth-arrested for 48 hours in serum-free medium. Medium was aspirated and replaced either with fresh serum-free medium (control) or serum-free medium containing 10 ng/ml TGFβ1 for times up to 72 hours. A: For collagen quantitation, cells were simultaneously metabolically labeled with 20 μCi/ml [3H]-proline and the collagen in each extract purified as described. Results are expressed as mean ± SEM (three independent experiments) for the total labeled collagen of the combined extracts after 72 hours under serum-free conditions (control) or in the presence of 10 ng/ml TGFβ1. Statistical analysis was performed using the paired Student’s t-test and statistical significance was taken as P < 0.05. B: mRNA was extracted from cells after 72 hours in serum-free medium (control) or in serum-free medium containing 10 ng/ml TGFβ1 as described in Materials and Methods and RT-PCR performed for the ED-A isoform of fibronectin. Products were separated on a 1% agarose gel and visualized under UV after ethidium bromide staining. Results show products from four individual experiments. HA in the medium of cells incubated in the presence or absence (control) of 10 ng/ml TGFβ1 was analyzed by enzyme-linked immunosorbent assay for times up to 72 hours (C) (statistical analysis was performed using the paired Student’s t-test and statistical significance was taken as P < 0.05) or metabolic labeling and gel filtration chromatography (D) as described.
Figure 4
Figure 4
Effect of inhibition of HA chain elongation on differentiation. Fibroblasts were growth-arrested for 48 hours. The medium was then changed and incubations continued in the absence (control) or presence of TGFβ1 for 72 hours. The inhibitor of HA chain elongation, 4-mU (or vehicle, 0.1% dimethyl sulfoxide) was added at various concentrations as shown. A: Dose-response of inhibition of TGFβ1-stimulated HA synthesis in response to 4-mU. Results are expressed as the mean ± SEM of four independent experiments. Statistical analysis was performed using the one-way analysis of variance test (P < 0.001) followed by Tukey’s HSD posthoc test and statistical significance was taken as P < 0.05. B: Effect of optimal dose of 4-mU on α-SMA expression, assessed by QPCR. Ribosomal RNA expression was used as an endogenous control and gene expression was assayed relative to control samples. The comparative CT method was used for relative quantification of gene expression and the results are expressed as the mean ± SEM of four independent experiments. Statistical analysis was performed using the one-way analysis of variance test (P < 0.001) followed by Tukey’s HSD posthoc test and statistical significance was taken as P < 0.05. C: Effect of optimal dose of 4-mU on pSmad 2 and 3 induction. Cells were growth arrested for 48 hours, then incubated with or without TGFβ1 in the presence or absence of 4-mU for 60 minutes. Cell protein was extracted and SDS-PAGE and Western blotting for phosphorylated Smads 2 and 3 performed as described. Results are representative of four independent experiments. D and E: Fibroblasts were transfected with HAS2-specific siRNA or a scrambled control for 48 hours in serum-free medium. The medium was changed and the cells stimulated with TGFβ1 (10 ng/ml) for a further 72 hours. mRNA was extracted and the expression of HAS2 (D) and α-SMA (E) were quantified by QPCR. Ribosomal RNA expression was used as an endogenous control and gene expression was assayed relative to control samples. The comparative CT method was used for relative quantification of gene expression and the results are expressed as the mean ± SEM of four independent experiments. Statistical analysis was performed using the one-way analysis of variance test (P < 0.001) followed by Tukey’s HSD posthoc test and statistical significance was taken as P < 0.05.
Figure 5
Figure 5
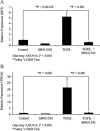
Effect of ALK 5 inhibition on HC3 and TSG-6 expression. Fibroblasts were growth-arrested for 48 hours. The medium was then changed and incubations continued in the absence (control) or presence of TGFβ1 for 72 hours with or without ALK 5 inhibition (10 μmol/L SB431542). mRNA was extracted and QPCR performed for HC3 (A) and TSG-6 (B) as described. Ribosomal RNA expression was used as an endogenous control and gene expression was assayed relative to control samples. The comparative CT method was used for relative quantification of gene expression and the results are expressed as the mean ± SEM of four independent experiments. Statistical analysis was performed using the one-way analysis of variance test (P < 0.001) followed by Tukey’s HSD posthoc test and statistical significance was taken as P < 0.05.
Figure 6
Figure 6
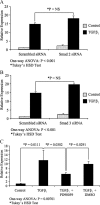
Effect of Smad and ERK inhibition on TSG-6 expression. Fibroblasts were transfected with (A) Smad2 or (B) Smad3-specific siRNA or a scrambled control for 48 hours in serum-free medium. The medium was changed and the cells stimulated with TGFβ1 (10 ng/ml) for a further 72 hours. Untransfected cells (C) underwent TGFβ1 stimulation for 72 hours in the presence or absence of 10 μmol/L PD98059 (or vehicle, 0.1% dimethyl sulfoxide). Cells were then extracted and QPCR performed for TSG-6 as described. Results represent the mean of four independent experiments. Ribosomal RNA expression was used as an endogenous control and gene expression was assayed relative to control samples. The comparative CT method was used for relative quantification of gene expression and the results are expressed as the mean ± SEM of four independent experiments. Statistical analysis was performed using the one-way analysis of variance test followed by Tukey’s HSD posthoc test and statistical significance was taken as P < 0.05.
Figure 7
Figure 7
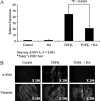
Effect of exogenous HA on α-sma induction. Fibroblasts were grown to near confluency and then growth-arrested for 48 hours in serum-free medium. Medium was aspirated and replaced with serum-free medium (control) or in serum-free medium containing 10 ng/ml TGFβ1 ± HA for 72 hours. A: mRNA was extracted from cells as described in Materials and Methods and QPCR performed for α-SMA. Ribosomal RNA expression was used as an endogenous control and gene expression was assayed relative to control samples. The comparative CT method was used for relative quantification of gene expression and the results are expressed as the mean ± SEM of four independent experiments. Statistical analysis was performed using the One-way analysis of variance (P < 0.001) test followed by Tukey’s HSD posthoc test and statistical significance was taken as P < 0.05. B: Corresponding expression of α-SMA protein was confirmed by fixing cells after 72 hours as described and immunostained for vimentin or α-SMA. Results are representative of three independent experiments.
Figure 8
Figure 8
Effect of HA on induction of α-SMA in myofibroblasts. Myofibroblasts were grown to near confluency and then growth-arrested for 48 hours in serum-free medium. Medium was aspirated and replaced either with fresh serum-free medium (Control) or serum-free medium containing 25 μg/ml HA, 10 ng/ml TGFβ1, or 10 ng/ml TGFβ1 in the presence of 25 μg/ml HA for 72 hours. mRNA was extracted and α-sma QPCR performed as described. Ribosomal RNA expression was used as an endogenous control and gene expression was assayed relative to control samples. The comparative CT method was used for relative quantification of gene expression and the results are expressed as the mean ± SEM of 5 independent experiments. Statistical analysis was performed using the One-way ANOVA (P = 0.00183) test followed by Tukey’s HSD Post-hoc Test and statistical significance was taken as P < 0.05.
Figure 9
Figure 9
Effect of HA on Smad 3 phosphorylation in fibroblasts and myofibroblasts. Fibroblasts (A) or myofibroblasts that had been differentiated by 72 hours incubation with 10 ng/ml TGFβ1 (B), were washed with PBS (×3), growth-arrested in serum-free medium for 48 hours and then stimulated for 60 minutes with 10 ng/ml TGFβ1 in the presence or absence of 25 μg/ml HA. Cell protein was extracted and SDS-PAGE and Western blotting for phosphorylated Smad 3 performed as described. Results are representative of six independent experiments.
Figure 10
Figure 10
Effect of HA on HC3 and TSG6 induction. Fibroblasts were growth-arrested for 48 hours. The medium was then changed and incubations continued in the absence (control) or presence of TGFβ1 for 72 hours with or without 25 μg/ml HA. Cells were then extracted and QPCR performed for HC3 (A) and TSG-6 (B) as described. Ribosomal RNA expression was used as an endogenous control and gene expression was assayed relative to control samples. The comparative CT method was used for relative quantification of gene expression and the results are expressed as the mean ± SEM of four independent experiments. Statistical analysis was performed using the one-way analysis of variance (P < 0.001) test followed by Tukey’s HSD posthoc test and statistical significance was taken as P < 0.05.
Figure 11
Figure 11
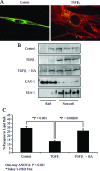
Receptor relocalization during differentiation. Fibroblasts were growth-arrested for 48 hours. The medium was then changed and incubations continued in the absence (control) or presence of TGFβ1 for 72 hours. A: The cells were fixed and immunostained for HYAL 2 (green) and CD44 (red). B: Cell protein was extracted and subjected to density gradient ultracentrifugation as described. Proteins in each fraction were separated by SDS-PAGE and the ALK-5 receptor identified by Western blotting. C: Results are expressed by densitometric analysis of blots from 4 independent experiments. Statistical analysis was performed using the one-way analysis of variance (P < 0.001) test followed by Tukey’s HSD posthoc test and statistical significance was taken as P < 0.05.

Similar articles

Cited by

References

    1. Gabbiani G. The myofibroblast in wound healing and fibrocontractive diseases. J Pathol. 2003;200:500–503. - PubMed
    1. Tomasek JJ, Gabbiani G, Hinz B, Chaponnier C, Brown RA. Myofibroblasts and mechano-regulation of connective tissue remodelling. Nat Rev Mol Cell Biol. 2002;3:349–363. - PubMed
    1. Desmouliere A, Darby IA, Gabbiani G. Normal and pathologic soft tissue remodeling: role of the myofibroblast, with special emphasis on liver and kidney fibrosis. Lab Invest. 2003;83:1689–1707. - PubMed
    1. Hinz B, Gabbiani G. Cell-matrix and cell-cell contacts of myofibroblasts: role in connective tissue remodeling. Thromb Haemost. 2003;90:993–1002. - PubMed
    1. Horowitz JC, Thannickal VJ. Idiopathic pulmonary fibrosis: new concepts in pathogenesis and implications for drug therapy. Treat Respir Med. 2006;5:325–342. - PMC - PubMed

Publication types

MeSH terms