

Political economy of US states and rates of fatal occupational injury
- PMID: 19542025
- PMCID: PMC2707476
- DOI: 10.2105/AJPH.2007.131409
Political economy of US states and rates of fatal occupational injury
Abstract
Objectives: We investigated the extent to which the political economy of US states, including the relative power of organized labor, predicts rates of fatal occupational injury.
Methods: We described states' political economies with 6 contextual variables measuring social and political conditions: "right-to-work" laws, union membership density, labor grievance rates, state government debt, unemployment rates, and social wage payments. We obtained data on fatal occupational injuries from the National Traumatic Occupational Fatality surveillance system and population data from the US national census. We used Poisson regression methods to analyze relationships for the years 1980 and 1995.
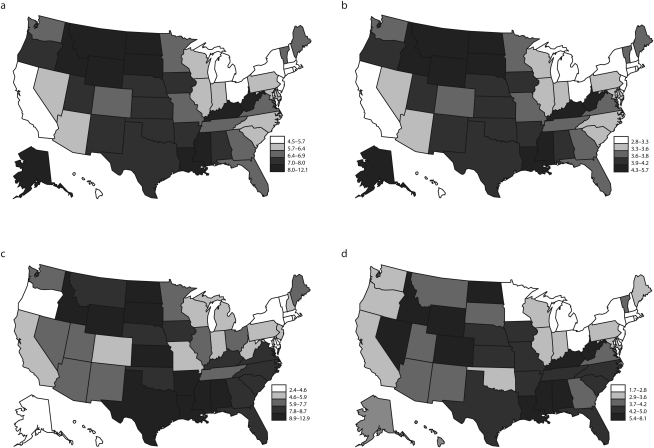
Results: States differed notably with respect to political-economic characteristics and occupational fatality rates, although these characteristics were more homogeneous within rather than between regions. Industry and workforce composition contributed significantly to differences in state injury rates, but political-economic characteristics of states were also significantly associated with injury rates, after adjustment accounting for those factors.
Conclusions: Higher rates of fatal occupational injury were associated with a state policy climate favoring business over labor, with distinct regional clustering of such state policies in the South and Northeast.
Figures
Similar articles
-
Comparison of unintentional fatal occupational injuries in the Republic of Korea and the United States.Inj Prev. 2004 Aug;10(4):199-205. doi: 10.1136/ip.2003.004895. Inj Prev. 2004. PMID: 15314045 Free PMC article.
-
Deindustrialisation and the long term decline in fatal occupational injuries.Occup Environ Med. 2004 Jul;61(7):616-21. doi: 10.1136/oem.2003.009571. Occup Environ Med. 2004. PMID: 15208378 Free PMC article.
-
Fatal occupational injuries in US industries, 1984: comparison of two national surveillance systems.Am J Public Health. 1988 Sep;78(9):1215-7. doi: 10.2105/ajph.78.9.1215. Am J Public Health. 1988. PMID: 3407824 Free PMC article.
-
Neoliberalism, "globalization," unemployment, inequalities, and the welfare state.Int J Health Serv. 1998;28(4):607-82. doi: 10.2190/Y3X7-RG7E-6626-FVPT. Int J Health Serv. 1998. PMID: 9842492 Review.
-
Occupational fatalities, injuries, illnesses, and related economic loss in the wholesale and retail trade sector.Am J Ind Med. 2010 Jul;53(7):673-85. doi: 10.1002/ajim.20813. Am J Ind Med. 2010. PMID: 20213749 Review.
Cited by
-
The proportion of work-related emergency department visits not expected to be paid by workers' compensation: implications for occupational health surveillance, research, policy, and health equity.Health Serv Res. 2013 Dec;48(6 Pt 1):1939-59. doi: 10.1111/1475-6773.12066. Epub 2013 May 13. Health Serv Res. 2013. PMID: 23662682 Free PMC article.
-
Health Power Resources Theory: A Relational Approach to the Study of Health Inequalities.J Health Soc Behav. 2021 Dec;62(4):493-511. doi: 10.1177/00221465211025963. J Health Soc Behav. 2021. PMID: 34846187 Free PMC article.
-
Does the Union Make Us Strong? Labor-Union Membership, Self-Rated Health, and Mental Illness: A Parametric G-Formula Approach.Am J Epidemiol. 2021 Apr 6;190(4):630-641. doi: 10.1093/aje/kwaa221. Am J Epidemiol. 2021. PMID: 33047779 Free PMC article.
-
Evaluation of a nationally funded state-based programme to reduce fatal occupational injuries.Occup Environ Med. 2012 Nov;69(11):810-4. doi: 10.1136/oemed-2011-100213. Epub 2012 Aug 3. Occup Environ Med. 2012. PMID: 22864251 Free PMC article.
-
Protecting labor rights: roles for public health.Public Health Rep. 2013 Nov;128 Suppl 3(Suppl 3):39-47. doi: 10.1177/00333549131286S307. Public Health Rep. 2013. PMID: 24179278 Free PMC article.
References
-
- Marsh SM, Layne LA. Fatal Injuries to Civilian Workers in the United States, 1980–1995 Cincinnati, OH: National Institute for Occupational Safety and Health; 1993. DHHS publication 2001-129S
Publication types
MeSH terms
Grants and funding
LinkOut - more resources
Full Text Sources
Medical
