. 2009 Sep;191(17):5458-70.
doi: 10.1128/JB.00355-09. Epub 2009 Jun 19.

CtrA, a global response regulator, uses a distinct second category of weak DNA binding sites for cell cycle transcription control in Caulobacter crescentus

Affiliations

CtrA, a global response regulator, uses a distinct second category of weak DNA binding sites for cell cycle transcription control in Caulobacter crescentus

William Spencer et al. J Bacteriol. 2009 Sep.

Abstract

CtrA controls cell cycle programs of chromosome replication and genetic transcription. Phosphorylated CtrA approximately P exhibits high affinity (dissociation constant [K(d)], <10 nM) for consensus TTAA-N7-TTAA binding sites with "typical" (N = 7) spacing. We show here that ctrA promoters P1 and P2 use low-affinity (K(d), >500 nM) CtrA binding sites with "atypical" (N not equal 7) spacing. Footprints demonstrated that phosphorylated CtrA approximately P does not exhibit increased affinity for "atypical" sites, as it does for sites in the replication origin. Instead, high levels of CtrA (>10 microM) accumulate, which can drive CtrA binding to "atypical" sites. In vivo cross-linking showed that when the stable CtrADelta3 protein persists during the cell cycle, the "atypical" sites at ctrA and motB are persistently bound. Interestingly, the cell cycle timing of ctrA P1 and P2 transcription is not altered by persistent CtrADelta3 binding. Therefore, operator DNA occupancy is not sufficient for regulation, and it is the cell cycle variation of CtrA approximately P phosphorylation that provides the dominant "activation" signal. Protein dimerization is one potential means of "activation." The glutathione S-transferase (GST) protein dimerizes, and fusion with CtrA (GST-CtrA) creates a stable dimer with enhanced affinity for TTAA motifs. Electrophoretic mobility shift assays with GST-CtrA revealed cooperative modes of binding that further distinguish the "atypical" sites. GST-CtrA also binds a single TTAA motif in ctrA P1 aided by DNA in the extended TTAACCAT motif. We discuss how "atypical" sites are a common yet distinct category of CtrA regulatory sites and new implications for the working and evolution of cell cycle control networks.


Figures

FIG. 1.
FIG. 1.
CtrA protein activity during the C. crescentus cell cycle. A nonreplicating but motile swarmer cell (Sw) differentiates into a replicating stalked cell (St). Growth of a predivisional cell (Div) produces a new flagellated swarmer pole. Segregating chromosomes are positioned in both the nonreplicating swarmer cell (rep−) and the replication-competent stalked cell (rep+). Shading indicates the temporal and spatial presence of CtrA. In wild-type (WT) cells, CtrA “activity” is controlled by cell cycle-programmed synthesis, proteolysis, and phosphorylation. In CtrAΔ3-containing cells, CtrA “activity” is controlled by cell cycle-programmed phosphorylation alone.
FIG. 2.
FIG. 2.
DNase I footprint analysis of CtrA and CtrA∼P binding to the ctrA P1 and P2 promoters and to the replication origin (Cori). (A) DNA sequence landmarks of the P1 and P2 promoters (6) and Cori (31). Bent arrows indicate RNA start sites. Cross-hatched and filled bars indicate the sequences protected in vitro from DNase I digestion by CtrA. P1 transcription is repressed in vivo, while P2 transcription is activated in vivo, and the minus and plus signs indicate that CtrA binding is repressive at P1 and activating at P2. (B) Simultaneous DNase I footprint assays for ctrA P1 and P2 and for CtrA Cori binding sites a and b. The diagram shows that the same protein mixture (His-CtrA and EnvZ kinase) was used (with or without 0.5 mM ATP) for all reactions. The binding reaction monomer concentrations of unphosphorylated (CtrA) and phosphorylated (CtrA∼P) proteins are indicated above the lanes. The DNA substrates (20,000 cpm per lane) were labeled with 32P at the 5′ end at unique XmnI (ctrA P1 and P2) and HindIII (Cori binding sites a and b) endonuclease sites.
FIG. 3.
FIG. 3.
ChIP analysis of CtrA protein binding to the ctrA P1 and P2 promoters of synchronized C. crescentus cells. Wild-type (WT) C. crescentus strain NA1000 cells or CtrAΔ3-containing (Δ3) C. crescentus strain NA1000 cells with plasmid pLS2747 were grown in M2G. Synchronized swarmer cells (Sw) were isolated (zero time) and allowed to proceed through the stalked (St) (45 min) and asymmetric division (Div) (100 min) stages, as indicated. The ChIP protocol was used for each of the cell samples, as described in Materials and Methods. The bars indicate the CtrA ChIP signals which were derived from PCR analysis as described in Materials and Methods.
FIG. 4.
FIG. 4.
(A) Cell cycle-regulated transcription monitored independently for the ctrA P1 promoter and for the ctrA P2 promoter in wild-type cells (filled squares) and in CtrAΔ3-containing cells (open diamonds). The lacZ transcription reporter plasmids pctrA-P1 and pctrA-P2 were individually introduced into wild-type strain (ctrA WT) cells and into CtrAΔ3-containing strain (+ctrAΔ3) cells, which were also used in the experiments whose results are shown in Fig. 3. These cells were synchronized similarly and sampled at the indicated times in the swarmer (Sw), stalked (St), and asymmetric division phases of the cell cycle. To measure transcription from the lacZ transcription reporters, the sampled cells were pulse-labeled for 10 min with [35S]methionine, the LacZ protein was immunoprecipitated from equal amounts of cell extracts, the radiolabeled LacZ protein was resolved by SDS-PAGE, and the radioactivity was measured by phosphorimaging. The results are expressed as percentages of the peak LacZ signal in wild-type cells. (B) Immunoblot analysis of CtrA protein levels in wild-type cells (CtrA WT) and in CtrAΔ3-containing cells (+ CtrAΔ3) from the cultures used for two experiments described above (left side in panel A). Equal amounts (optical density, 0.1) of cells were assayed at the indicated times during the cell cycles.
FIG. 5.
FIG. 5.
(A) The promoter TTAA motifs of motB match those of ctrA P1 and P2. Both promoters also lack the typical N = 7 spacing. (B) ChIP analysis of CtrA protein binding to the motB promoter of synchronized C. crescentus cells. Wild-type (WT) C. crescentus strain NA1000 cells or CtrAΔ3-containing (Δ3) C. crescentus cells (strain NA1000 with plasmid pLS2747) were grown, sampled, and analyzed as described in the legend to Fig. 3, except that the motB-specific primers were used in the PCR analysis, as described in Materials and Methods. Sw, swarmer cells; St, stalked cells; Div, cells in the asymmetric division stage.
FIG. 6.
FIG. 6.
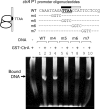
Sample EMSA experiments illustrating GST-CtrA protein binding to P1 ctrA (promoter) and to Cori (replication origin) oligonucleotides. As described in Materials and Methods, following electrophoresis, the gel was first stained with ethidium bromide and then with Coomassie blue, and side-by-side photographs are shown. The bars above the ethidium bromide-stained lanes indicate the different oligonucleotides used (the black sections indicate the TTAA motifs). The following double-stranded oligonucleotides were used (their sequences are shown in Fig. 8): lane 1, P1 m1; lane 2, P1 m2; lane 4, wild-type P1; lane 5, P1 m3; lane 6, wild-type Cori binding site c; lane 7, Cori binding site c m1. Bovine serum albumin (2.0 μg) was also loaded in lane 3, and other protein molecular weight standards were loaded in flanking lanes (not shown). “Bound DNA” indicates bands in lanes 4 to 6 that were stained with both ethidium bromide and Coomassie blue. “Free DNA” indicates the oligonucleotides whose mobility was not altered by the protein, and “released” indicates the smear of DNA that presumably bound but disassociated during electrophoresis. “Free protein” indicates the positions of the GST-CtrA whose mobility was not altered by the DNA. WT, wild type; BSA, bovine serum albumin.
FIG. 7.
FIG. 7.
Sample EMSA experiments illustrating GST-CtrA protein binding to the ctrA P2 promoter and Cori (replication origin) oligonucleotides. Except for the different oligonucleotides, the experiments were identical to those whose results are shown in Fig. 6. The following oligonucleotides were used (their sequences are shown in Fig. 8): lane 1, wild-type Cori binding sites a and b; lane 2, P2 N7; lane 3, wild-type P2; lane 4, wild-type Cori binding site c; lane 5, P2 m1; lane 6, P2 m2; lane 7, P2 m3; lane 8, P2 m123. WT, wild type.
FIG. 8.
FIG. 8.
Double-stranded oligonucleotides (A) based on the ctrA P1 and P2 promoters and (B) based on the Cori replication origin. The bars indicate the established CtrA footprints. The full sequence of the wild type (unaltered DNA) is shown, and only the changes are shown below for the corresponding DNA molecules, which were used for the binding experiments whose results are shown in Fig. 6 and 7. WT, wild type.
FIG. 9.
FIG. 9.
Cartoons comparing and contrasting GST-CtrA binding to ctrA P1 and P2 and GST-CtrA binding to Cori. The bars indicate the different double-stranded DNA oligonucleotides described in Fig. 6 to 8. The pairs of ovals represent GST-CtrA dimer molecules apparently held together by the N-terminal GST domain. The different binding configurations are discussed in the text. WT, wild type.
FIG. 10.
FIG. 10.
EMSA experiments using GST-CtrA protein and ctrA P1 promoter oligonucleotides with scanning mutations across the single TTAA motif. The experiments confirmed the primary importance of TTAA (m5), and they revealed the secondary importance of its flanking CCAT motif (m6) for affinity to GST-CtrA. The full-length wild-type P1 double-stranded oligonucleotide is shown in Fig. 8, and variations of this oligonucleotide (m4, m5, m6, and m7) are identical to wild-type P1 except at the positions of the GGTC blocks, as shown. Otherwise, the experimental conditions were the same as those described in the legends to Fig. 6 and 7. The GST-CtrA protein was added to the reaction mixtures in the alternate lanes. The GST-CtrA preparation also contained a significant amount of contaminating DNA from the E. coli chromosome (shown in the control lane on the left). Only the ethidium-bromide stained gel is shown. WT, wild type.

Similar articles

Cited by

References

    1. Bachhawat, P., G. V. T. Swapna, G. T. Montelione, and A. M. Stock. 2005. Mechanism of activation for transcription factor PhoB suggested by different modes of dimerization in the inactive and active states. Structure 131353-1363. - PMC - PubMed
    1. Barnett, M. J., D. Y. Hung, A. Reisenauer, L. Shapiro, and S. R. Long. 2001. A homolog of the CtrA cell cycle regulator is present and essential in Sinorhizobium meliloti. J. Bacteriol. 1833204-3210. - PMC - PubMed
    1. Bellefontaine, A.-F., C. E. Pierreux, P. Mertens, J. Vandenhaute, J.-J. Letesson, and X. De Bolle. 2002. Plasticity of a transcriptional regulatory network among alpha-proteobacteria is supported by the identification of CtrA targets in Brucella abortus. Mol. Microbiol. 43945-960. - PubMed
    1. Biondi, E. G., S. J. Reisinger, J. M. Skerker, M. Arif, B. S. Perchuk, K. R. Ryan, and M. T. Laub. 2006. Regulation of the bacterial cell cycle by an integrated genetic circuit. Nature 444899-904. - PubMed
    1. Domian, I. J., K. C. Quon, and L. Shapiro. 1997. Cell type-specific phosphorylation and proteolysis of a transcriptional regulator controls the G1 to S transition in a bacterial cell cycle. Cell 90415-424. - PubMed

Publication types