. 2009 Sep;191(17):5377-86.
doi: 10.1128/JB.00597-09. Epub 2009 Jun 19.

Proteomic and genomic characterization of highly infectious Clostridium difficile 630 spores

Affiliations

Proteomic and genomic characterization of highly infectious Clostridium difficile 630 spores

Trevor D Lawley et al. J Bacteriol. 2009 Sep.

Abstract

Clostridium difficile, a major cause of antibiotic-associated diarrhea, produces highly resistant spores that contaminate hospital environments and facilitate efficient disease transmission. We purified C. difficile spores using a novel method and show that they exhibit significant resistance to harsh physical or chemical treatments and are also highly infectious, with <7 environmental spores per cm(2) reproducibly establishing a persistent infection in exposed mice. Mass spectrometric analysis identified approximately 336 spore-associated polypeptides, with a significant proportion linked to translation, sporulation/germination, and protein stabilization/degradation. In addition, proteins from several distinct metabolic pathways associated with energy production were identified. Comparison of the C. difficile spore proteome to those of other clostridial species defined 88 proteins as the clostridial spore "core" and 29 proteins as C. difficile spore specific, including proteins that could contribute to spore-host interactions. Thus, our results provide the first molecular definition of C. difficile spores, opening up new opportunities for the development of diagnostic and therapeutic approaches.


Figures
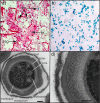
FIG. 1.
FIG. 1.
Visualization of pure C. difficile spores. (a) Endospore stain of C. difficile culture showing the pink vegetative cells (veg) and pink extracellular matrix (ex), with a few interspersed green spores (sp). (b) Purified C. difficile spores are stained green. (c) Transmission electron microscopy of sectioned C. difficile spores, demonstrating the spore ultrastructure including the exosporium, coat, cortex, core, membrane, and ribosomes. Bar, 100 nm. (d) Magnified section of outer surface of spore. Bar, 50 nm.
FIG. 2.
FIG. 2.
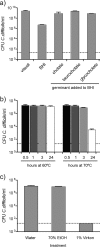
Pure C. difficile spores are viable and maintain their resistant nature. (a) Germination of pure C. difficile spores in response to cholate, taurocholate, or glycocholate. Spores were serially diluted and plated onto BHI agar plates containing 0.1% of the indicated germinant. Spores were also enumerated visually with a light microscope. (b) Heat resistance properties of spores. Spores were incubated in distilled water heated to 60°C or 70°C for the indicated times. (c) Chemical resistance properties of spores. Spores were incubated in water, 70% ethanol (EtOH), or 1% Virkon for 20 min at room temperature. After incubation, spores were serially diluted and plated onto BHI agar plates containing 0.5% taurocholate. Germinated spores were counted after 48 h of growth at 37°C under anaerobic conditions. The detection limit of 5 × 101 C. difficile CFU/ml is indicated by a dashed horizontal line.
FIG. 3.
FIG. 3.
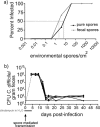
Environmental C. difficile 630 spores are highly infective. (a) Infective dose curves of pure and feces-derived C. difficile 630 spores in mice (n = 3) after exposure to environmental spore contamination. Based on the Reed-Muench formulation, the ID50 of environmental spores with a 1-h exposure is 4 spores/cm2 for fecal spores (gray lines) and 7 spores/cm2 for pure spores (black lines). Data are representative of two independent experiments. (b) Fecal shedding of C. difficile 630 from infected mice (n = 6) demonstrates that spores establish intestinal carriage in infected mice. The broken gray line represents the expected shedding pattern during the induction of high-level C. difficile shedding. The detection limit of 5 × 101 C. difficile CFU/g of feces is indicated by a dashed horizontal line.
FIG. 4.
FIG. 4.
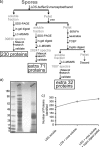
Summary of scheme to determine the spore proteome. (a) SDS-PAGE gel of vegetative cells (veg) (left lane) and pure spores (right lane) after solubilization with LDS. (b) Flow diagram outlining the steps required to solubilize proteins from C. difficile spores and the number of extra proteins liberated at each stage. (c) Rarefaction curve showing the decrease in the number of extra proteins with each additional solubilization step.
FIG. 5.
FIG. 5.
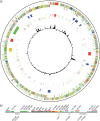
Representation of the C. difficile strain 630 genome, highlighting genes encoding the spore proteome. (a) Circular representation. The concentric circles represent the following (from outside in): first and second circles, all CDS (transcribed clockwise and counterclockwise); third circle, locations of prophage (red), conjugative transposons (blue), and carbohydrate utilization (green) and cell wall (orange) loci; fourth and fifth circles, CDS that code for spore proteins (transcribed clockwise and counterclockwise); sixth circle, G+C content (plotted using a 10-kb window). (b) Linear representation of a 27.8-kb region of the C. difficile strain 630 genome that contains the genes encoding several spore proteins, including a hypothetical cysteine-rich protein (CD1067) that is abundant in C. difficile spores. Red horizontal lines above CDS indicate those that encode proteins found in mature C. difficile spores. The genes are color coded as follows: dark blue, pathogenicity/adaptation; black, energy metabolism; red, information transfer; dark green, surface association; cyan, degradation of large molecules; magenta, degradation of small molecules; yellow, central/intermediary metabolism; pale green, unknown; pale blue, regulators; orange, conserved hypothetical protein; brown, pseudogenes; pink, phage and insertion elements; gray, miscellaneous.
FIG. 6.
FIG. 6.
Representation of the distribution and abundance, by functional class, of C. difficile 630 spore proteins. Shown are the absolute number of proteins (filled bars, left axis) and the percentage of each functional class in spores relative to the total genome (shaded bars, right axis). Functional classes are described in reference .
FIG. 7.
FIG. 7.
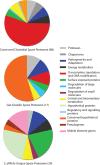
Comparative analysis of the C. difficile 630 spore proteome to 11 clostridial genomes. Diagrams summarize the C. difficile spore protein functional classes shared among clostridia (top), shared between C. difficile and C. bartlettii (center), and unique to C. difficile (bottom).

Similar articles

Cited by

References

    1. Allen, J. E., M. C. Cerrone, P. R. Beatty, and R. S. Stephens. 1990. Cysteine-rich outer membrane proteins of Chlamydia trachomatis display compensatory sequence changes between biovariants. Mol. Microbiol. 41543-1550. - PubMed
    1. Bartlett, J. G. 2006. The new epidemic of Clostridium difficile-associated enteric disease. Ann. Intern. Med. 145758-764. - PubMed
    1. Bartlett, J. G., T. Chang, N. S. Taylor, and A. B. Onderdonk. 1979. Colitis induced by Clostridium difficile. Rev. Infect. Dis. 1370-378. - PubMed
    1. Borriello, S. P. 1998. Pathogenesis of Clostridium difficile infection. J. Antimicrob. Chemother. 41(Suppl. C)13-19. - PubMed
    1. Borriello, S. P., and P. Honour. 1981. Simplified procedure for the routine isolation of Clostridium difficile from faeces. J. Clin. Pathol. 341124-1127. - PMC - PubMed

Publication types

LinkOut - more resources