

Review
doi: 10.2214/AJR.09.2601.
Advanced MRI methods for assessment of chronic liver disease
Affiliations
- PMID: 19542391
- PMCID: PMC2989464
- DOI: 10.2214/AJR.09.2601
Item in Clipboard
Review
Advanced MRI methods for assessment of chronic liver disease
AJR Am J Roentgenol.
2009 Jul.
Abstract
Objective: With recent advances in technology, advanced MRI methods such as diffusion-weighted and perfusion-weighted MRI, MR elastography, chemical shift-based fat-water separation, and MR spectroscopy can now be applied to liver imaging. We will review the respective roles of these techniques for assessment of chronic liver disease.
Conclusion: MRI plays an increasingly important role in assessment of patients with chronic liver disease because of the lack of ionizing radiation and the possibility of performing multiparametric imaging.
Figures

Although the pathophysiology of NAFLD (non alcoholic fatty liver disease) is not entirely understood, it is generally thought that insulin resistance leads to the intracellular accumulation of triglycerides and fatty acids, which are known to cause oxidative stress. The presence of an unknown second “hit” leads to the development of inflammation (NASH: non-alcoholic steatohepatitis), injury and fibrosis, an ultimately cirrhosis. Like all patients with cirrhosis, those with NASH are at increased risk of liver failure or HCC.

52 year-old male with chronic hepatitis C without evidence of fibrosis at liver biopsy (F0-top row) and 67 year-old female with cirrhosis secondary to chronic hepatitis C (F4-bottom row). Breath-hold fat suppressed TSE T2-weighted image and breath-hold fat suppressed single shot echoplanar diffusion-weighted images for b=0, and b=700 mm2/s and ADC map (using b=0 and 700 mm2/s) are shown. In the patient without fibrosis, hepatic ADC was within normal range, measuring 1.6 × 10⁻³ s/mm2., the liver appearing brighter than the spleen (which is known to have low ADC). In the cirrhotic patient, T2-weighted image shows minimal morphologic changes in relation with cirrhosis. However, hepatic ADC was decreased (reaching the spleen ADC), measuring 1.0 × 10⁻³ s/mm2 (according to the ADC values described by Taouli et al [77]).

54-year old female with cirrhosis secondary to chronic hepatitis C. Perfusion MR images of the liver (top) obtained using a coronal 3D interpolated spoiled gradient-recalled echo sequence covering the entire liver before and after injection of 10 ml of Gd-DTPA with a temporal resolution of approximately 3 sec. Selected time points from 35 measures are shown in chronological order (top to bottom, left to right). Progressive opacification of the aorta, hepatic artery, portal vein and liver parenchyma are observed. Signal intensity vs. time curve (bottom) obtained by placing regions of interest (ROIs) in the aorta (used as a surrogate for the hepatic artery), portal vein and liver parenchyma. Visually, there is evidence for delayed enhancement of the liver parenchyma. A dual input single compartmental model [87, 88] was used to compute the perfusion parameters, which showed increased arterial fraction (36%), hepatic arterial flow (14.5 ml/100g/min), distribution volume (27%) and mean transit time (40 sec), and decreased hepatic portal venous flow (29 ml/100g/min) consistent with advanced fibrosis/cirrhosis [88] .

Magnetic resonance elastography as performed in a standard scanner. A plastic drum-like passive driver device is placed over the liver to generate shear waves that can be imaged with a special phase-contrast MRI sequence. The abdominal acoustic driver is powered by a speaker-like device (on left) that can be placed outside the magnet room and connected to the passive driver by flexible tubing. Propagating shear waves are imaged and then the information is processed to generate elastograms, which quantitatively depict the stiffness of tissues.

Left column: T2-weighted anatomic images. Middle column: MRE wave images. Right column: MR elastograms, stiffness of liver tissue. Top Row: The liver has normal appearance in the anatomic image, and the wave image shows that shear waves at 60 Hz have a short wavelength, consistent with the normally soft mechanical characteristics of normal liver tissue. The elastogram shows a mean stiffness value of 2.1 kPa, well below the upper limit of normal (2.9 kPa), indicating the absence of hepatic fibrosis. Middle row: This patient also has a normal-appearing liver, but the wave images show relative prolongation of the visualized shear waves. The elastogram shows an abnormally high mean stiffness value of 4.8 kPa, consistent with moderate hepatic fibrosis. Biopsy demonstrated stage 1 fibrosis. Bottom row: Third patient has an abnormal hepatic contour and ascites, consistent with chronic liver disease. The wave image shows marked lengthening of the visualized shear waves. The elastogram shows that liver stiffness is markedly heterogeneous, with many confluent areas measuring more than 8 kPa in stiffness. Biopsy confirmed the presence of moderate to advanced fibrosis.

In-phase (left) and out of phase (right) images in two patients with hepatic steatosis. Marked dropout on out-of-phase images is present in patient 1, consistent with qualitatively severe steatosis. Mild signal dropout is seen on the out of phase image of patient 2, with focal fatty sparing near the gallbladder fossa, consistent with mild steatosis (white arrow).

Fat fraction MR image (left) obtained using a T1 independent, T2* corrected acquisition with accurate spectral modeling using the IDEAL (Iterative Decomposition of water and fat with Echo Asymmetry and Least squares estimation) water-fat separation methods [122, 124, 126, 132] demonstrates close agreement with single voxel MR spectroscopy from a 2×2×2 cm voxel from the posterior segment of the right lobe of the liver (square). Fatty sparing in the gallbladder fossa (white arrow) is noted incidentally. At least six discrete fat spectral peaks (denoted by *) can be seen in the spectrum.

Fat fraction MR image in a 350 lb woman before (left) and after (right) a 27 lb weight loss in 27 days, acquired using Bydder’s T1 independent, T2* corrected method with accurate spectral modeling [125]. Overall fat fraction was variable throughout the liver, but demonstrated changes of approximately 3-5% from an initial fat fraction of 16-24%. Fat in adipose tissue appears black because of the inherent ambiguity of fat fractions greater than 50%, however, excellent quantification of hepatic steatosis can be achieved using this method (Image courtesy Masoud Shiehmorteza, Liver imaging Group, UCSD).

T2* weighted (TE=10ms) gradient echo image of a patient with transfusional hemosiderosis (left) qualitatively demonstrates iron overload through decreased signal in the spleen (short arrow) and bone marrow (arrowhead) in addition to the liver. Note also the sparing of the pancreas (thin arrow). In contrast, the right image shows a T2 weighted fast spin-echo (TE=80ms) image from a patient with genetic hemochromatosis demonstrating decreased signal in the pancreas (thin arrow) in addition to the liver, with sparing of the spleen (short arrow) and bone marrow (arrowhead). The patterns of signal dropout are easily depicted on these conventional imaging methods, which are very helpful in distinguishing the etiology of these two forms of iron overload. However, assessing the severity of disease requires quantitative methods.
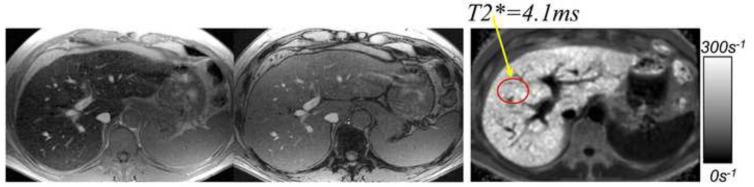
In-phase (left) and out of phase (middle) images in a patient with genetic hemochromatosis demonstrates paradoxical signal drop out of the liver on the in-phase image. This occurs because the TE of the in-phase image (4.6ms) is longer than the out of phase image (2.3ms) leading to signal dropout from accelerated T2* decay in the presence of iron overload. Note the lack of signal dropout in the spleen, which is characteristic of genetic hemochromatosis. An R2* map acquired from the same patient using the method of Yu et al [126] is shown on the right, demonstrating a markedly abnormal R2*=240s−1 (T2*=4.1ms).

R2* images measured using the method of Yu et al [126], in a patient with genetic hemochromatosis, before (left) and after (right) one year of phlebotomy therapy. Before therapy, R2*=192s−1 (T2*=5.2ms) and after one year of phlebotomy, R2*=106s−1 (T2*=9.4ms), demonstrating a treatment response that correlates with a drop in serum ferritin from 184 ng/ml to 91 ng/ml.

In-phase and out of phase (left) images in a patient with biopsy proven hepatic iron overload and steatosis. Signal intensities in the in-phase and out of phase images were nearly identical (846 AU and 851 AU, respectively) suggesting neither fat nor iron. However, simultaneous estimation of fat and R2* using the method of Yu et al [126] indicates abnormal level of steatosis (9%) and shortened T2* (15.1ms, normal = 25-30ms). Also note the shortened T2* in the spleen (9.7 ms), which can also be inferred through signal drop out in the spleen on the in-phase image (white arrow).
References
-
- Afdhal NH, Nunes D. Evaluation of liver fibrosis: a concise review. Am J Gastroenterol. 2004;99:1160–1174. - PubMed
-
- Alter MJ, Kruszon-Moran D, Nainan OV, et al. The prevalence of hepatitis C virus infection in the United States, 1988 through 1994. N Engl J Med. 1999;341:556–562. - PubMed
-
- Kim WR, Gross JB, Jr., Poterucha JJ, Locke GR, 3rd, Dickson ER. Outcome of hospital care of liver disease associated with hepatitis C in the United States. Hepatology. 2001;33:201–206. - PubMed
-
- Lauer GM, Walker BD. Hepatitis C virus infection. N Engl J Med. 2001;345:41–52. - PubMed
Publication types
MeSH terms
Grants and funding
LinkOut - more resources
Full Text Sources
Other Literature Sources
Medical
