

Modulating the expression of IFN regulatory factor 8 alters the protumorigenic behavior of CD11b+Gr-1+ myeloid cells
- PMID: 19542426
- PMCID: PMC2744444
- DOI: 10.4049/jimmunol.0804132
Modulating the expression of IFN regulatory factor 8 alters the protumorigenic behavior of CD11b+Gr-1+ myeloid cells
Erratum in
- J Immunol. 2009 Aug 15;183(4):2884
Abstract
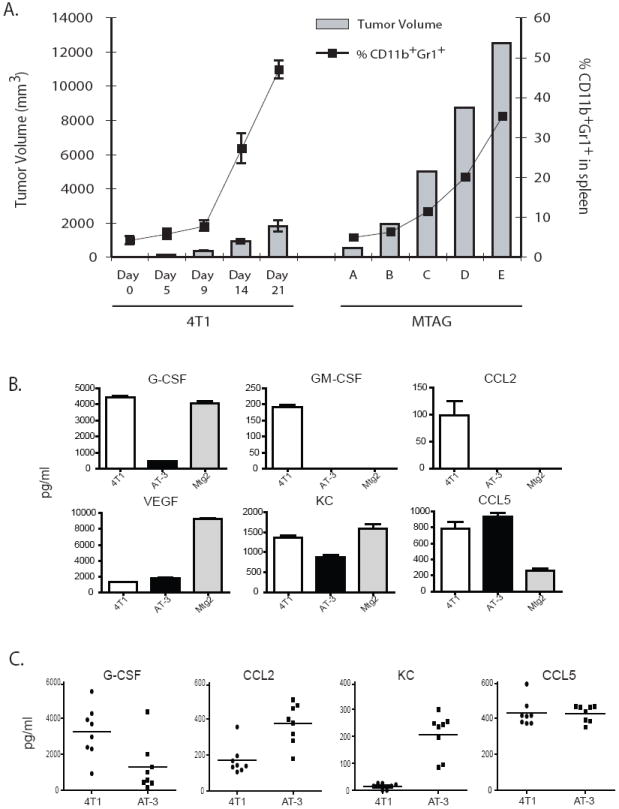
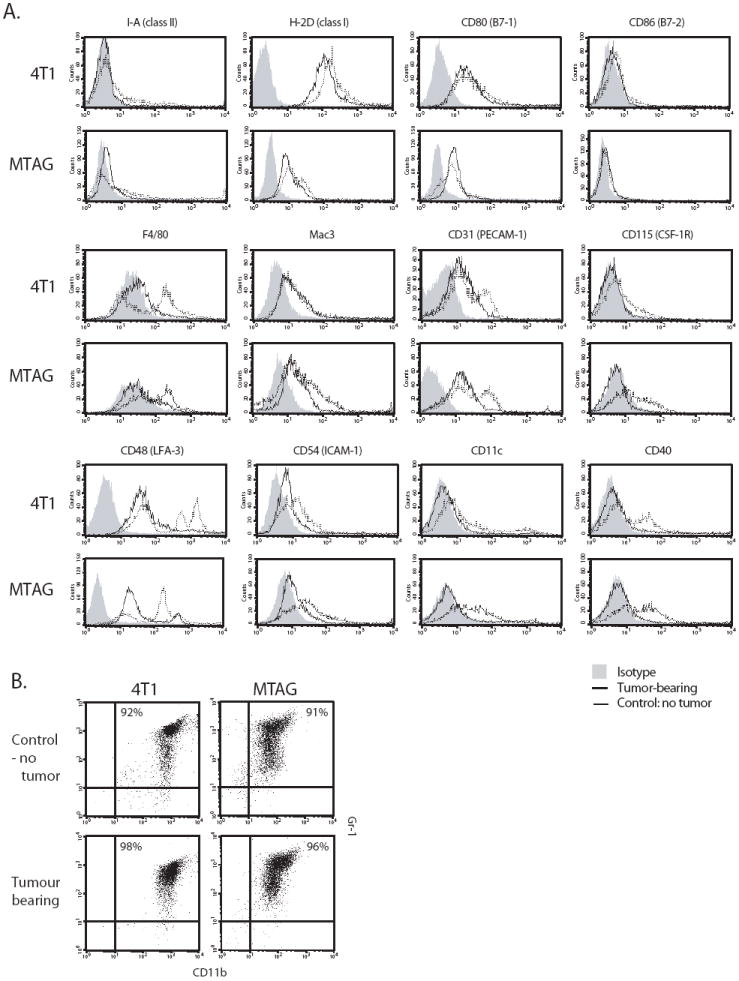
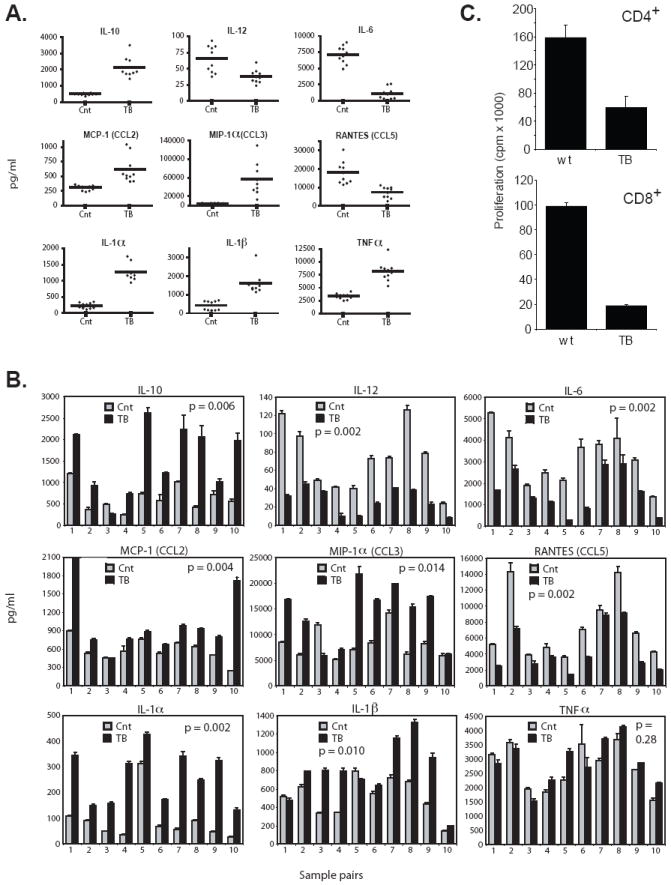
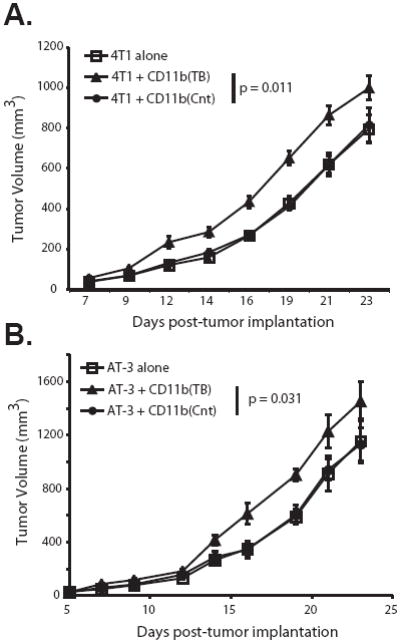
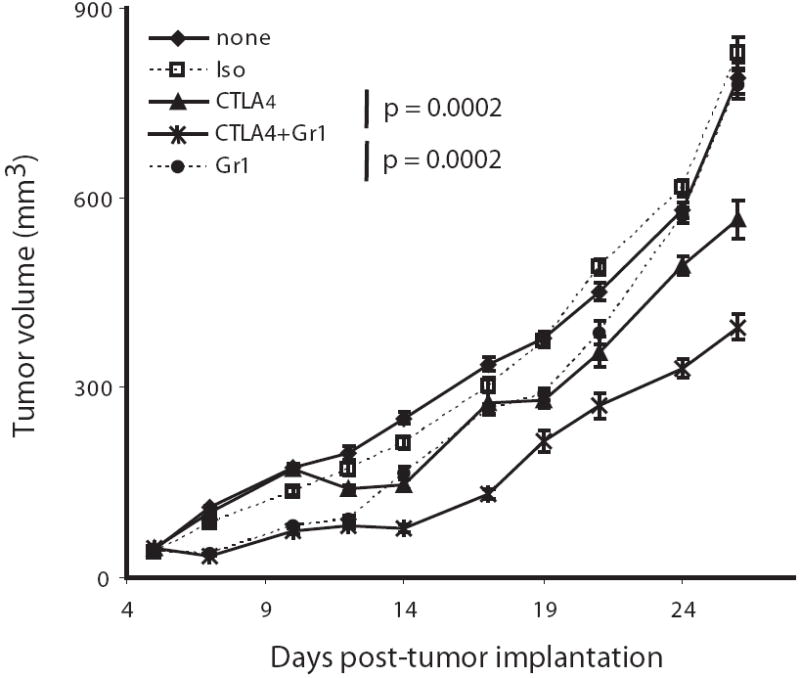
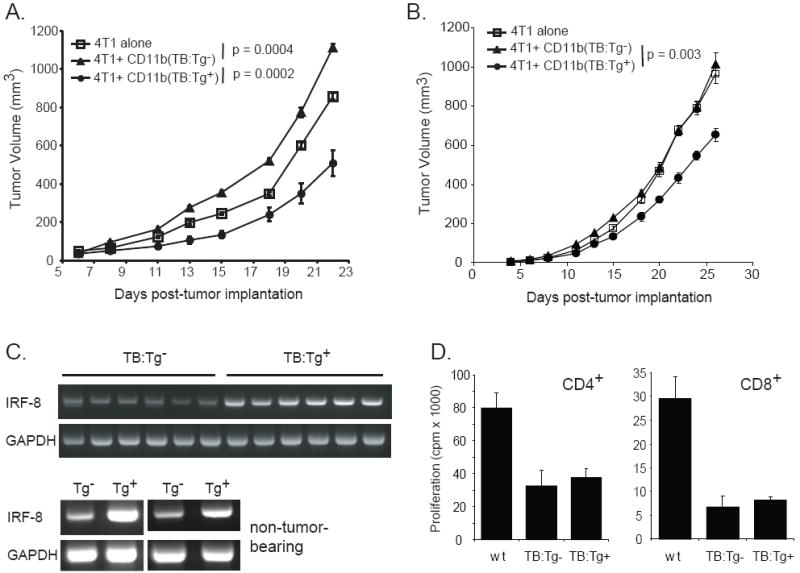
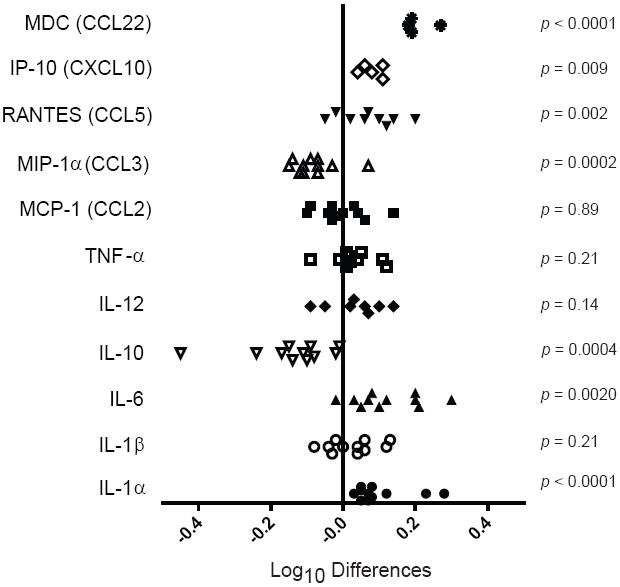
CD11b(+)Gr-1(+)-expressing cells, termed myeloid-derived suppressor cells, can mediate immunosuppression and tumor progression. However, the intrinsic molecular events that drive their protumorigenic behavior remain to be elucidated. Although CD11b(+)Gr-1(+) cells exist at low frequencies in normal mice, it also remains unresolved whether they are biologically distinct from those of tumor-bearing hosts. These objectives were investigated using CD11b(+)Gr-1(+) cells from both implantable (4T1) and autochthonous (mouse mammary tumor virus-polyomavirus middle T Ag (MMTV-PyMT)) mouse models of mammary carcinoma. Limited variation was observed in the expression of markers associated with immunoregulation between CD11b(+)Gr-1(+) cells of both tumor models, as well as with their respective controls (Cnt). Despite limited differences in phenotype, tumor-induced CD11b(+)Gr-1(+) cells were found to produce a more immunosuppressive cytokine profile than that observed by Cnt CD11b(+)Gr-1(+) cells. Furthermore, when admixed with tumor cells, CD11b(+)Gr-1(+) cells from tumor-bearing mice significantly enhanced neoplastic growth compared with counterpart cells from Cnt mice. However, the protumorigenic behavior of these tumor-induced CD11b(+)Gr-1(+) cells was significantly diminished when the expression of IFN regulatory factor 8, a key myeloid-associated transcription factor, was enhanced. The loss of this protumorigenic effect occurred independently of the host immune system and correlated with a CD11b(+)Gr-1(+) cytokine/chemokine production pattern that resembled cells from nontumor-bearing Cnt mice. Overall, our data indicate that 1) tumor-induced CD11b(+)Gr-1(+) cells from both cancer models were phenotypically similar, but biologically distinct from their nontumor-bearing counterparts and 2) modulation of IFN regulatory factor 8 levels in tumor-induced CD11b(+)Gr-1(+) cells can significantly abrogate their protumorigenic behavior, which may have important implications for cancer therapy.
Figures
Similar articles
-
Interferon regulatory factor-8 modulates the development of tumour-induced CD11b+Gr-1+ myeloid cells.J Cell Mol Med. 2009 Sep;13(9B):3939-50. doi: 10.1111/j.1582-4934.2009.00685.x. J Cell Mol Med. 2009. PMID: 20196788 Free PMC article.
-
Gr-1+CD11b+ cells are responsible for tumor promoting effect of TGF-β in breast cancer progression.Int J Cancer. 2012 Dec 1;131(11):2584-95. doi: 10.1002/ijc.27572. Epub 2012 May 8. Int J Cancer. 2012. PMID: 22487809 Free PMC article.
-
Potential differentiation of tumor bearing mouse CD11b+Gr-1+ immature myeloid cells into both suppressor macrophages and immunostimulatory dendritic cells.Biomed Res. 2009 Feb;30(1):7-15. doi: 10.2220/biomedres.30.7. Biomed Res. 2009. PMID: 19265258
-
miR-130a and miR-145 reprogram Gr-1+CD11b+ myeloid cells and inhibit tumor metastasis through improved host immunity.Nat Commun. 2018 Jul 4;9(1):2611. doi: 10.1038/s41467-018-05023-9. Nat Commun. 2018. PMID: 29973593 Free PMC article.
-
Transforming growth factor beta: tumor suppressor or promoter? Are host immune cells the answer?Cancer Res. 2008 Nov 15;68(22):9107-11. doi: 10.1158/0008-5472.CAN-08-2556. Cancer Res. 2008. PMID: 19010878 Free PMC article. Review.
Cited by
-
Tumor-induced MDSC act via remote control to inhibit L-selectin-dependent adaptive immunity in lymph nodes.Elife. 2016 Dec 8;5:e17375. doi: 10.7554/eLife.17375. Elife. 2016. PMID: 27929373 Free PMC article.
-
The Granulocyte Progenitor Stage Is a Key Target of IRF8-Mediated Regulation of Myeloid-Derived Suppressor Cell Production.J Immunol. 2017 May 15;198(10):4129-4139. doi: 10.4049/jimmunol.1601722. Epub 2017 Mar 29. J Immunol. 2017. PMID: 28356386 Free PMC article.
-
Tumor-derived G-CSF facilitates neoplastic growth through a granulocytic myeloid-derived suppressor cell-dependent mechanism.PLoS One. 2011;6(11):e27690. doi: 10.1371/journal.pone.0027690. Epub 2011 Nov 16. PLoS One. 2011. PMID: 22110722 Free PMC article.
-
Multimodal Intralesional Therapy for Reshaping the Myeloid Compartment of Tumors Resistant to Anti-PD-L1 Therapy via IRF8 Expression.J Immunol. 2021 Sep 1;207(5):1298-1309. doi: 10.4049/jimmunol.2100281. Epub 2021 Aug 6. J Immunol. 2021. PMID: 34362833 Free PMC article.
-
Blockade of p38 kinase impedes the mobilization of protumorigenic myeloid populations to impact breast cancer metastasis.Int J Cancer. 2020 Oct 15;147(8):2279-2292. doi: 10.1002/ijc.33050. Epub 2020 May 28. Int J Cancer. 2020. PMID: 32452014 Free PMC article.
References
-
- Serafini P, Borrello I, Bronte V. Myeloid suppressor cells in cancer: recruitment, phenotype, properties, and mechanisms of immune suppression. Semin Cancer Biol. 2006;16:53–65. - PubMed
-
- Talmadge JE. Pathways mediating the expansion and immunosuppressive activity of myeloid-derived suppressor cells and their relevance to cancer therapy. Clin Cancer Res. 2007;13:5243–5248. - PubMed
-
- Bobe P, Benihoud K, Grandjon D, Opolon P, Pritchard LL, Huchet R. Nitric oxide mediation of active immunosuppression associated with graft-versus-host reaction. Blood. 1999;94:1028–1037. - PubMed
-
- Makarenkova VP, Bansal V, Matta BM, Perez LA, Ochoa JB. CD11b+/Gr-1+ myeloid suppressor cells cause T cell dysfunction after traumatic stress. J Immunol. 2006;176:2085–2094. - PubMed
Publication types
MeSH terms
Substances
Grants and funding
LinkOut - more resources
Full Text Sources
Molecular Biology Databases
Research Materials
