. 2009 Jul 1;183(1):332-9.
doi: 10.4049/jimmunol.0900691.

The initial phase of an immune response functions to activate regulatory T cells

Affiliations

The initial phase of an immune response functions to activate regulatory T cells

William E O'Gorman et al. J Immunol. .

Abstract

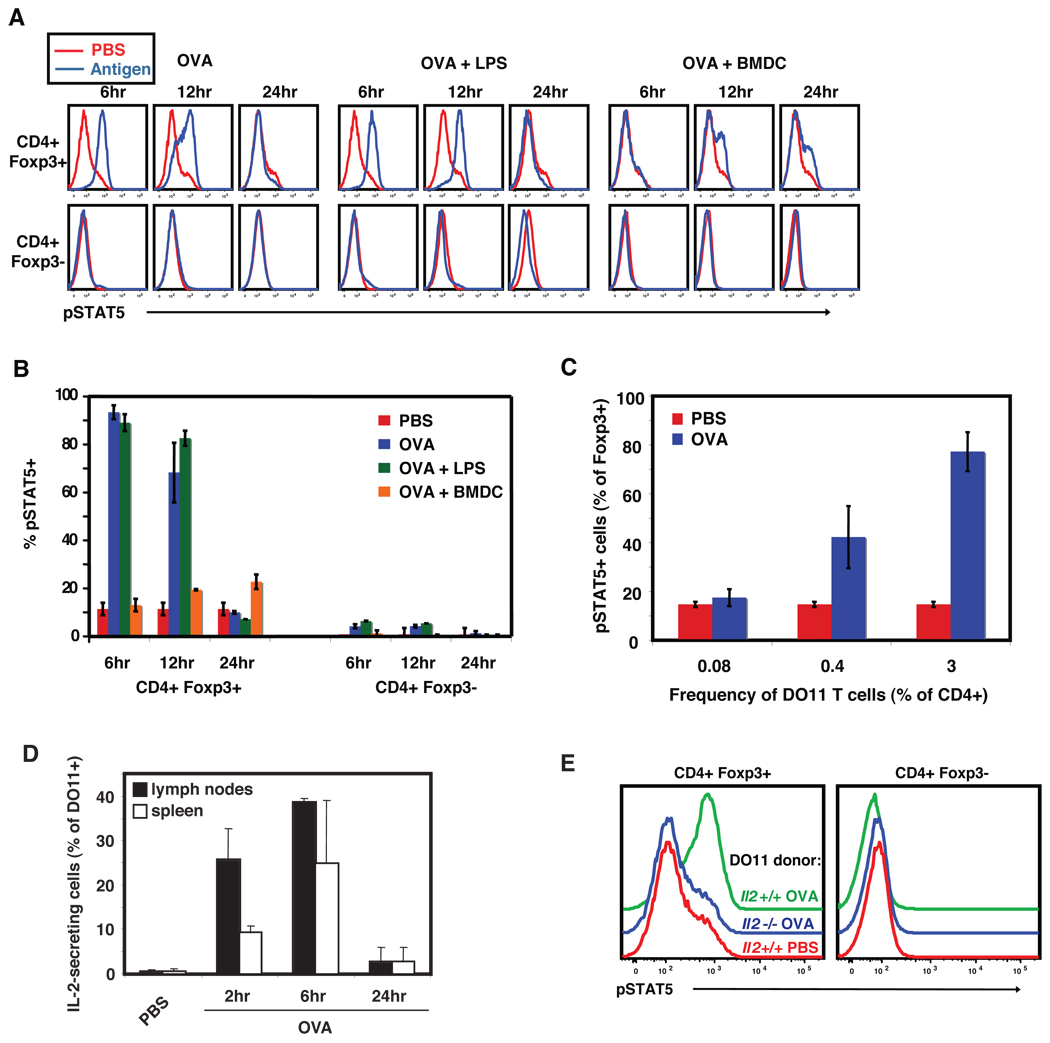
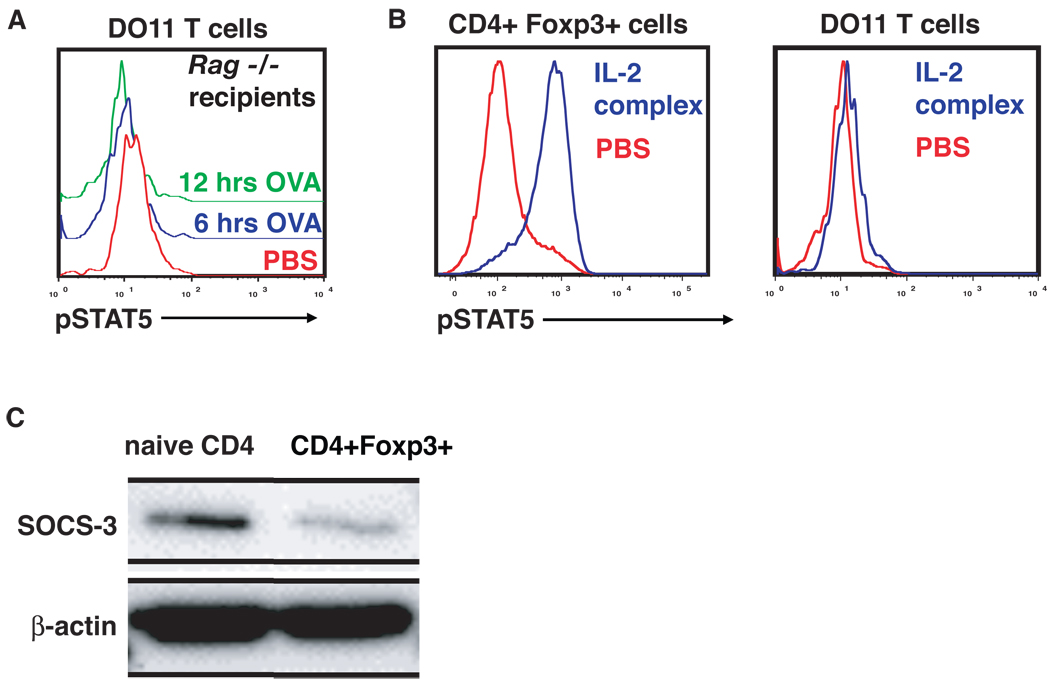
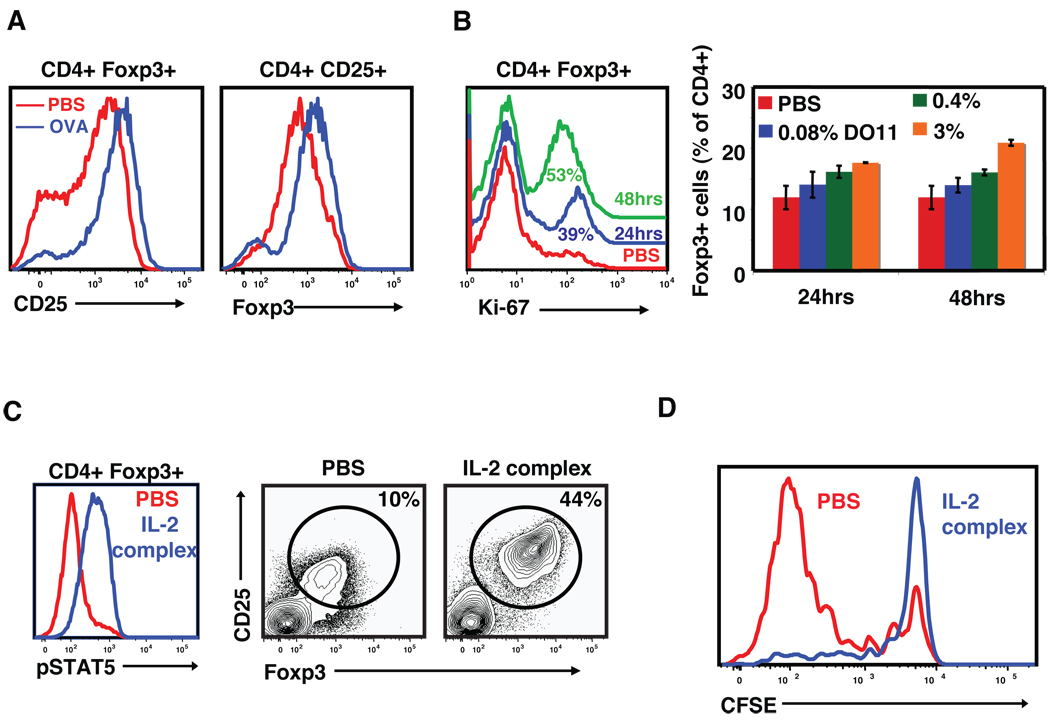
An early reaction of CD4(+) T lymphocytes to Ag is the production of cytokines, notably IL-2. To detect cytokine-dependent responses, naive Ag-specific T cells were stimulated in vivo and the presence of phosphorylated STAT5 molecules was used to identify the cell populations responding to IL-2. Within hours of T cell priming, IL-2-dependent STAT5 phosphorylation occurred primarily in Foxp3(+) regulatory T cells. In contrast, the Ag-specific T cells received STAT5 signals only after repeated Ag exposure or memory differentiation. Regulatory T cells receiving IL-2 signals proliferated and developed enhanced suppressive activity. These results indicate that one of the earliest events in a T cell response is the activation of endogenous regulatory cells, potentially to prevent autoimmunity.


Figures

Figure 1
Figure 1. T-cell priming induces STAT5 phosphorylation in “bystander” Foxp3+ cells
5 × 10⁶ DO11 T cells were adoptively transferred into BALB/c recipients and treated with PBS or stimulated with 100 µg OVA. 6 (blue) and 12 (green) hours after OVA stimulation, or control PBS injection (red), spleens were harvested and analyzed for pSTAT5 induction in the indicated cell types, identified by the listed phenotypic markers. Data in this and all following figures are representative of at least two independent experiments.
Figure 2
Figure 2. pSTAT5 induction in Foxp3+ T cells is dependent on IL-2 produced by antigen-stimulated T cells
(A) 5 × 10⁶ DO11 T cells were adoptively transferred into BALB/c recipients and treated with PBS (red), or stimulated (blue) with OVA (100 µg) or OVA+ LPS (20 µg); 1 × 10⁶ transferred DO11 T cells were primed with 3 × 10⁶ OVA-pulsed BMDC. At the indicated times, spleen cells were fixed and permeabilized and CD4+Foxp3+ cells (upper panels) and CD4+Foxp3- T cells (lower panels) were analyzed for STAT5 phosphorylation. (B) Numbers (% +/− SD) of pSTAT5+ cells within the CD4+Foxp3+ and CD4+Foxp3-populations (PBS, red; OVA, blue; OVA + LPS, green; OVA-pulsed BMDC, orange; N=4–6 mice/group). (C) 5 × 10⁴, 5 × 10⁵, or 5 × 10⁶ DO11/Rag−/− T cells were transferred into BALB/c recipients and pSTAT5 induction in splenocytes was analyzed 8 hours after OVA administration. % of pSTAT5+ Foxp3+ T cells is shown as a function of DO11 cell frequency in the spleen (+/− SD, 4 mice/group). (D) DO11/Rag−/− T cells were adoptively transferred into BALB/c recipients and, at the indicated times after OVA stimulation, IL-2 secretion by DO11 cells was measured using an IL-2 capture assay. (E) WT or Il-2−/− DO11/Rag−/− T cells were adoptively transferred into BALB/c recipients and, 9 hrs after OVA stimulation (PBS, red; Il-2−/− + OVA, blue; Il-2+/+ + OVA, green), pSTAT5 induction in CD4+Foxp3+ and CD4+Foxp3- cells was analyzed.
Figure 3
Figure 3. pSTAT5 is induced in antigen-specific T cells only after repeated antigen exposure or memory differentiation
(A) DO11 T cells were adoptively transferred, stimulated and analyzed for pSTAT5 as in Fig. 2A. In order to directly compare median fluorescence intensity between naïve and activated T cells, changes in background staining were normalized based on scatter profiles (see Materials and Methods). (B) pSTAT5, and CD25 expression in DO11 T cells and endogenous CD4+ Foxp3+ T cells were analyzed at 12 hrs after immunization with OVA + LPS (DO11/PBS, red; DO11/OVA + LPS, blue; Foxp3+ cells/OVA + LPS, green). (C) Naïve DO11 T cells were adoptively transferred and stimulated with 100 µg OVA323–339 (blue) or treated with PBS (red). Spleens were harvested 16 hrs later and expression of the IL-2Rα, IL-2/15Rβ and γc chains on DO11+CD4+ T cells (upper panels) and endogenous Foxp3+CD4+ Treg (lower panels) was analyzed by antibody staining and flow cytometry. (D) WT or Il-2−/− DO11 T cells were stimulated with OVA-pulsed DCs as in Fig. 2A, challenged 60 hrs later with OVA peptide (100 µg), and pSTAT5 induction in the DO11 cells was analyzed 8 hrs later (PBS, red; DO11 Il-2−/− + OVA, blue; DO11 Il-2+/+ + OVA, green). (E) 1 × 10⁶ DO11 T cells were primed as in Fig. 2A and 5 weeks later mice were challenged with OVA + LPS or PBS. pSTAT5 induction in memory DO11 T cells and endogenous CD4+ Foxp3+ cells was analyzed 8 hrs later (PBS, red; OVA + LPS, blue). (F) DO11 T cells were adoptively transferred and treated as in Fig. 1. Spleens were harvested at 6 (blue) and 12 hours (green) after OVA stimulation, or control PBS injection (red), and pSTAT5 induction analyzed in endogenous CD4 and CD8 memory T cells.
Figure 4
Figure 4. Cell-intrinsic regulation of pSTAT5 signaling
(A) 1×10⁶ DO11 T cells were adoptively transferred into Rag−/− mice and primed with 100 µg OVA peptide or PBS control (red). At 6 hrs (blue) and 12 hrs (green) following OVA priming, spleens were harvested and DO11 cells analyzed for pSTAT5 induction. (B) 2×10⁶ DO11 T cells were adoptively transferred to BALB/c mice and immunized with OVA peptide (100 µg). 12 hours after immunization, recipients were treated with IL-2/anti-IL-2 antibody complexes (blue) or with PBS control (red). 6 hours following complex injection, spleens were harvested and DO11 cells were analyzed for STAT5 phosphorylation. (C) Western blot analysis showing SOCS-3 protein expression in naïve Foxp3- CD4+ T cells (CD4+CD45RBhighGFP-) and Foxp3+ Tregs (CD4+CD45RBlowGFP+) sorted from Foxp3-GFP reporter mice.
Figure 5
Figure 5. IL-2 stimulation increases the expression of molecules necessary for Treg function, causes Treg proliferation, and enhances Treg suppression of activated DO11 T cells
(A) 5 × 10⁶ DO11 T cells were adoptively transferred and treated with PBS (red) or OVA (blue). 24 hrs later, CD25 and Foxp3 expression was analyzed in the indicated subsets by flow cytometry. (B) Ki-67 expression in CD4+Foxp3+ cells was monitored at 24 hrs (blue) and 48 hrs (green) following DO11 T cell transfer and injection of PBS (red) or OVA. The right panel shows the % of Foxp3+ cells as a function of the frequency of primed DO11 cells. (C) BALB/c mice were injected with IL-2/anti-IL-2 complexes and 48 hrs later induction of pSTAT5 in the CD4+Foxp3+ cells (left panel) and expression of CD25 and Foxp3 in CD4+ cells (right panels) were analyzed. (D) BALB/c mice were treated with IL-2/anti-IL-2 complexes or PBS and, on day 2 after start of treatment, 5 × 10⁶ CFSE-labeled DO11 T cells were injected into the treated mice. On day 3, the mice were treated with PBS or 10 µg of OVA. CFSE dilution in DO11 Tcells in mice treated with PBS (red) or IL-2 complex (blue) is shown as a measure of cell division.
Figure 6
Figure 6. Viral infection activates endogenous CD4+Foxp3+ T cells
(A) PBS (red) or various doses (based on pfu) of vaccinia virus (blue) were injected into BALB/c mice. pSTAT5 was analyzed in CD4+Foxp3+ cells at 8 hrs (top panel) and 24 hrs (bottom panel) following infection. (B) BALB/c mice were infected with 1 × 10⁷ pfu of vaccinia virus and 2 weeks later mice were challenged with the same dose. pSTAT5 induction in CD4+Foxp3+ cells was analyzed in naïve and primed mice at the indicated times after infection (PBS, red; primary infection, blue; secondary challenge, green). (C) Kinetics of pSTAT5 responses in CD4+Foxp3+ cells (% +/− SD, N=2) following primary and recall virus infection. (D) Ki-67 expression in CD4+Foxp3+ cells was assayed in response to viral infection (PBS, red; 24 hrs post-infection, blue; 72 hrs post-infection, green).

References

    1. Sakaguchi S. Regulatory T cells: key controllers of immunologic self-tolerance. Cell. 2000;101:455–458. - PubMed
    1. Belkaid Y, Piccirillo CA, Mendez S, Shevach EM, Sacks DL. CD4+CD25+ regulatory T cells control Leishmania major persistence and immunity. Nature. 2002;420:502–507. - PubMed
    1. Suvas S, Kumaraguru U, Pack CD, Lee S, Rouse BT. CD4+CD25+ T cells regulate virus-specific primary and memory CD8+ T cell responses. J Exp Med. 2003;198:889–901. - PMC - PubMed
    1. Lund JM, Hsing L, Pham TT, Rudensky AY. Coordination of Early Protective Immunity to Viral Infection by Regulatory T Cells. Science. 2008 - PMC - PubMed
    1. Bluestone JA, Abbas AK. Natural versus adaptive regulatory T cells. Nat Rev Immunol. 2003;3:253–257. - PubMed

Publication types

MeSH terms