. 2009 Jul 1;183(1):631-41.
doi: 10.4049/jimmunol.0900396.

Aberrant tissue localization of fungus-specific CD4+ T cells in IL-10-deficient mice

Affiliations

Aberrant tissue localization of fungus-specific CD4+ T cells in IL-10-deficient mice

Amariliz Rivera et al. J Immunol. .

Abstract

Aspergillus fumigatus, a common environmental fungus, can cause lethal invasive infections in immunocompromised hosts. In immunocompetent individuals, however, inhaled A. fumigatus spores prime CD4(+) T cells and activate immune responses that prevent invasive infection. Calibration of inflammatory responses to levels that prevent fungal invasion without inducing collateral tissue damage is essential for host survival, but the underlying regulatory mechanisms remain undefined. Although IL-10 is a validated regulatory cytokine that suppresses immune responses, and IL-10 deficiency or blockade generally enhances immune responses, we find that A. fumigatus-specific T cell frequencies are markedly reduced in airways of IL-10-deficient mice. T cell priming, proliferation, and survival were unaffected by IL-10 deficiency and did not account for decreased frequencies of A. fumigatus-specific T cells in the airways of IL-10-deficient mice. Instead, IL-10 deficiency results in redistribution of A. fumigatus-specific T cells from infected lungs to the gut, a process that is reversed by antibiotic-mediated depletion of intestinal microbes. Our studies demonstrate that disregulated immune responses in the gut can result in dramatic redistribution of pathogen-specific T cells within the host.


Conflict of interest statement

Disclosures: The authors have no financial conflict of interest.

Figures

FIGURE 1
FIGURE 1
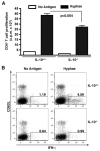
Diminished frequency of A. fumigatus-specific CD4+ T cell responses in IL-10−/− mice. CD4+ T cell responses in IL-10−/− and control mice were assessed 6 days after an intratracheal infection with 107 live, A. fumigatus spores. A, CD4+ T cells were purified from the MLN of IL-10−/− and control mice and cultured with APCs in the presence (■) or absence (□) of A. fumigatus hyphal Ags. Values shown are mean ± SD of six individual wells per group and are representative of three individual experiments. B, BALF cells were cultured with APCs with or without A. fumigatus Ags before intracellular cytokine staining and FACS analysis. Data shown are for CD4+ gated populations and are representative of results obtained in three individual experiments. Numbers represent the percentage of IFN-γ producing cells.
FIGURE 2
FIGURE 2
Diminished frequency of A. fumigatus-specific CD4+ TCR-tg cells in the airways of IL-10−/− mice. IL-10−/− or control Thy1.2 mice were adoptively transferred with 2 × 10⁴, naive Thy1.1/1.2 Af3.16 TCR-tg cells 1 day before a pulmonary infection with A. fumigatus spores. Recipients were analyzed 6 days after infection. All data shown are representative of three to four mice per group in four separate experiments. A, Frequency of Af3.16 TCR-tg cells among CD4+ T cells recovered from the lung-draining, MLN. FACS plots are gated on CD4+ cells and are for individual mice representative of each group. B, Total number of Af3.16 TCR-tg CD4+ T cells recovered from the MLN of IL-10−/− or control mice. Each symbol represents one mouse. C, Frequency of Af3.16 TCR-tg CD4+ cells among CD4+ T cells recovered from the airways of IL-10−/− or control mice. FACS plots are gated on CD4+ cells and are for individual mice representative of each group. D, Total number of Af3.16 TCR-tg CD4+ T cells recovered from the airways (BALF) of IL-10−/− or control mice. Each symbol represents one mouse. E, Total number of Af3.16 TCR-tg CD4+ T cells recovered from the lung parenchyma of IL-10−/− or control mice. Each symbol represents one mouse. F, Frequency of IFN-γ-producing cells among Af3.16 TCR-tg CD4+ T cells recovered from the airways (BALF). BALF cells were stimulated for 4 h with APCs in the presence or absence of hyphal Ags before intracellular cytokine staining. FACS plots are gated on Af3.16 TCR-tg CD4+ cells and are for individual, representative mice.
FIGURE 3
FIGURE 3
Diminished frequency of A. fumigatus-specific CD4+ TCR-tg cells in the airways of IL-10R2−/− mice. Congenically marked, naive Af3.16 TCR-tg CD4+ cells were adoptively transferred into IL-10R2−/− or control mice one day before a pulmonary infection with live A. fumigatus spores. Recipients were analyzed 6 days after infection. Data shown are representative of three to four mice per group in three individual experiments. A, Frequency of Af3.16 TCR-tg cells among CD4+ T cells recovered from the MLN. FACS plots are gated on CD4+ T cells and are for individual mice representative of each group. B, Total number of Af3.16 TCR-tg CD4+ T cells in the MLN of IL-10R2−/− or control mice. Each symbol represents one mouse. C, Frequency of Af3.16 TCR-tg CD4+ cells among CD4+ T cells recovered from the airways of IL-10R2−/− or control mice. FACS plots are gated on CD4+ cells and are for individual mice representative of each group. D, Total number of Af3.16 TCR-tg CD4+ T cells recovered from the airways (BALF) of IL-10R2−/− or control mice. Each symbol represents one mouse.
FIGURE 4
FIGURE 4
Similar expansion, differentiation, and trafficking of IL-10-unresponsive, A. fumigatus-specific CD4+ T cells. Congenically marked, Af3.16-WT and Af3.16-IL-10R2−/− CD4+ TCR-tg cells were mixed in vitro at 1:1 ratio and adoptively transferred into WT recipients 1 day before a pulmonary infection with A. fumigatus spores. Mice were analyzed 6 days after infection. Data shown are for three to four mice per group in three separate experiments. A, Frequency of Af3.16-WT (Thy1.1/1.1) and Af3.16-IL-10R2−/− (Thy1.1/1.2) among CD4+ T cells in the lymph node (MLN) and airways (BALF) of infected recipients. B, Total number of Af3.16-WT and Af3.16-IL-10R2−/− TCR-tg CD4+ T cells in the MLN. Each symbol represents one mouse. C, Total number of Af3.16-WT and Af3.16-IL-10R2−/− TCR-tg CD4+ T cells in the airways. Each symbol represents one mouse. D, Frequency of IFN-γ-producing Af3.16 TCR-tg CD4+ T cells in the airways of infected mice. BALF cells were stimulated for 4 h with APCs in the presence or absence of hyphal Ags before intracellular cytokine staining. FACS plots are gated on Af3.16 TCR-tg CD4+ cells, Af3.16-WT (Thy1.2), and Af3.16-IL-10R2−/− (Thy1.2+) are displayed. Plots are for individual, representative mice. Numbers in each gate are for the frequency of IFN-γ- producing cells in individually gated populations.
FIGURE 5
FIGURE 5
Aberrant distribution of Af3.16 TCR-tg CD4+ T cells in IL-10-deficient mice. Af3.16 CD4+ TCR-tg cells were primed in vitro and retrovirally transduced to induce the expression of a click-beetle luciferase gene (CBR-luc). Equal numbers of modified Af3.16 TCR-tg cells were adoptively transferred by i.v. delivery into infected IL-10−/− or control hosts. The location of transferred Af3.16-luciferase expressing CD4+ T cells was assessed by bioluminescence imaging on a Xenogen IVIS optical imaging system. Data shown are representative of five mice per group in three independent experiments. AD, Pseudocolor images superimposed on conventional photographs are shown for mice imaged at various times after Af3.16-luciferase T cell transfer. Photographs are for representative mice from three independent experiments and were assembled with Adobe Photoshop software. All photographs shown were acquired after a total exposure time of 3 min. E, Bioluminescent signal intensities were measured with Living Image version 2.6.1 software and are shown as photons/second/square centimeter/steradian. Data shown are for signal intensities measured in infected IL-10−/− (■) or control recipient mice (formula image) over the whole mouse (Total [T]), in the thoracic region (Trx), or over the abdominal cavity (Abd). Bar graphs are cumulative for signal intensities measured in a total of 15 mice per group in three separate experiments. F, Total number of Af3.16 TCR-tg CD4+ T cells recovered from the airways (BALF) of IL-10−/− (■) and control (formula image) mice and are cumulative of three separate experiments.
FIGURE 6
FIGURE 6
Treatment of IL-10−/− mice with broad-spectrum antibiotics restores fungus-specific CD4+ T cell accumulation in the airways. WT and IL-10-deficient recipients were treated with a mixture of broad-spectrum antibiotics metronidazole, neomycin, and vancomycin (MNV) for 3 wk before the adoptive transfer of naive Af3.16 TCR-tg cells (A and B) or in vitro primed Af3.16 Th1 TCR-tg cells (C and D). A, MNV treated and untreated control recipients were infected with live A. fumigatus spores and analyzed 6 days after infection. FACS plots are for representative mice from each group and are gated on CD4+ T cells recovered from the airways of infected hosts. B, Total number of Af3.16 CD4+ TCR-tg cells recovered from the airways of IL-10−/− (■) or control mice (□) in untreated (upper graph) or MNV-treated (bottom graph) recipients. Data in each bar are for a total of 8–10 mice from two separate experiments. C, Af3.16 Th1 TCR-tg cells were adoptively transferred into infected recipients. FACS plots are from representative mice in each group and are gated on CD4+ T cells recovered from the airways. D, Total number of Af3.16 Th1 TCR-tg cells recovered from the airways of IL-10−/− (■) or control mice (□) that were untreated (upper graph) or treated with MNV (bottom graph). Data in each bar are for a total of eight to ten mice from two separate experiments.

Similar articles

Cited by

References

    1. Hohl TM, Feldmesser M. Aspergillus fumigatus: principles of pathogenesis and host defense. Eukaryot Cell. 2007;6:1953–1963. - PMC - PubMed
    1. Einsele H, Loeffler J. Contribution of new diagnostic approaches to antifungal treatment plans in high-risk haematology patients. Clin Microbiol Infect. 2008;4 14:37–45. - PubMed
    1. Brakhage AA, Langfelder K. Menacing mold: the molecular biology of Aspergillus fumigatus. Annu Rev Microbiol. 2002;56:433–455. - PubMed
    1. Perruccio K, Tosti A, Burchielli E, Topini F, Ruggeri L, Carotti A, Capanni M, Urbani E, Mancusi A, Aversa F, et al. Transferring functional immune responses to pathogens after haploidentical hematopoietic transplantation. Blood. 2005;106:4397–4406. - PMC - PubMed
    1. Bozza S, Perruccio K, Montagnoli C, Gaziano R, Bellocchio S, Burchielli E, Nkwanyuo G, Pitzurra L, Velardi A, Romani L. A dendritic cell vaccine against invasive aspergillosis in allogeneic hematopoietic transplantation. Blood. 2003;102:3807–3814. - PubMed

Publication types

MeSH terms