

Cholinergic receptor signaling modulates spontaneous firing of sinoatrial nodal cells via integrated effects on PKA-dependent Ca(2+) cycling and I(KACh)
- PMID: 19542482
- PMCID: PMC2755991
- DOI: 10.1152/ajpheart.01340.2008
Cholinergic receptor signaling modulates spontaneous firing of sinoatrial nodal cells via integrated effects on PKA-dependent Ca(2+) cycling and I(KACh)
Abstract
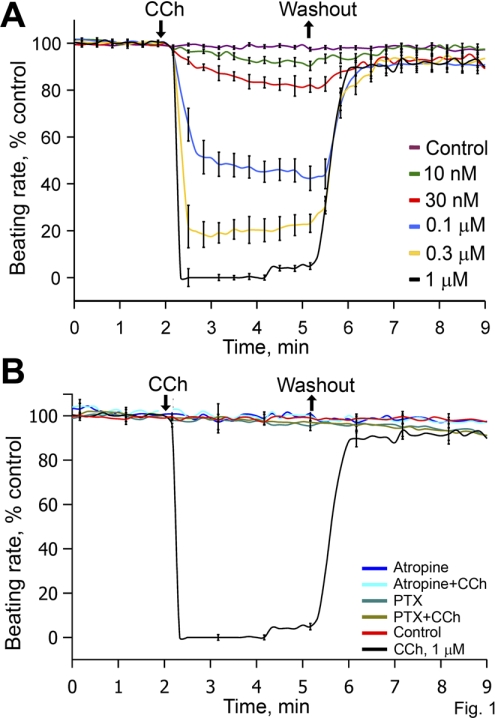
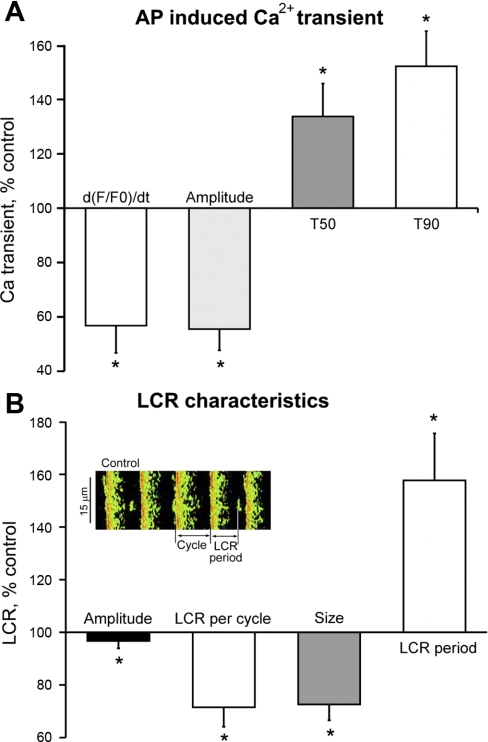
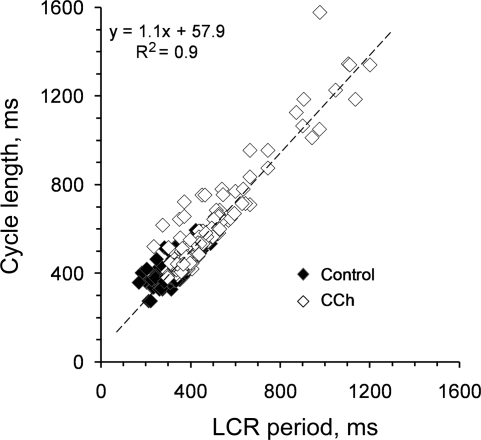
Prior studies indicate that cholinergic receptor (ChR) activation is linked to beating rate reduction (BRR) in sinoatrial nodal cells (SANC) via 1) a G(i)-coupled reduction in adenylyl cyclase (AC) activity, leading to a reduction of cAMP or protein kinase A (PKA) modulation of hyperpolarization-activated current (I(f)) or L-type Ca(2+) currents (I(Ca,L)), respectively; and 2) direct G(i)-coupled activation of ACh-activated potassium current (I(KACh)). More recent studies, however, have indicated that Ca(2+) cycling by the sarcoplasmic reticulum within SANC (referred to as a Ca(2+) clock) generates rhythmic, spontaneous local Ca(2+) releases (LCR) that are AC-PKA dependent. LCRs activate Na(+)-Ca(2+) exchange (NCX) current, which ignites the surface membrane ion channels to effect an AP. The purpose of the present study was to determine how ChR signaling initiated by a cholinergic agonist, carbachol (CCh), affects AC, cAMP, and PKA or sarcolemmal ion channels and LCRs and how these effects become integrated to generate the net response to a given intensity of ChR stimulation in single, isolated rabbit SANC. The threshold CCh concentration ([CCh]) for BRR was approximately 10 nM, half maximal inhibition (IC(50)) was achieved at 100 nM, and 1,000 nM stopped spontaneous beating. G(i) inhibition by pertussis toxin blocked all CCh effects on BRR. Using specific ion channel blockers, we established that I(f) blockade did not affect BRR at any [CCh] and that I(KACh) activation, evidenced by hyperpolarization, first became apparent at [CCh] > 30 nM. At IC(50), CCh reduced cAMP and reduced PKA-dependent phospholamban (PLB) phosphorylation by approximately 50%. The dose response of BRR to CCh in the presence of I(KACh) blockade by a specific inhibitor, tertiapin Q, mirrored that of CCh to reduced PLB phosphorylation. At IC(50), CCh caused a time-dependent reduction in the number and size of LCRs and a time dependent increase in LCR period that paralleled coincident BRR. The phosphatase inhibitor calyculin A reversed the effect of IC(50) CCh on SANC LCRs and BRR. Numerical model simulations demonstrated that Ca(2+) cycling is integrated into the cholinergic modulation of BRR via LCR-induced activation of NCX current, providing theoretical support for the experimental findings. Thus ChR stimulation-induced BRR is entirely dependent on G(i) activation and the extent of G(i) coupling to Ca(2+) cycling via PKA signaling or to I(KACh): at low [CCh], I(KACh) activation is not evident and BRR is attributable to a suppression of cAMP-mediated, PKA-dependent Ca(2+) signaling; as [CCh] increases beyond 30 nM, a tight coupling between suppression of PKA-dependent Ca(2+) signaling and I(KACh) activation underlies a more pronounced BRR.
Figures


Similar articles
-
A full range of mouse sinoatrial node AP firing rates requires protein kinase A-dependent calcium signaling.J Mol Cell Cardiol. 2011 Nov;51(5):730-9. doi: 10.1016/j.yjmcc.2011.07.028. Epub 2011 Aug 4. J Mol Cell Cardiol. 2011. PMID: 21840316 Free PMC article.
-
Phosphoprotein Phosphatase 1 but Not 2A Activity Modulates Coupled-Clock Mechanisms to Impact on Intrinsic Automaticity of Sinoatrial Nodal Pacemaker Cells.Cells. 2021 Nov 10;10(11):3106. doi: 10.3390/cells10113106. Cells. 2021. PMID: 34831329 Free PMC article.
-
Basal Spontaneous Firing of Rabbit Sinoatrial Node Cells Is Regulated by Dual Activation of PDEs (Phosphodiesterases) 3 and 4.Circ Arrhythm Electrophysiol. 2018 Jun;11(6):e005896. doi: 10.1161/CIRCEP.117.005896. Circ Arrhythm Electrophysiol. 2018. PMID: 29880528 Free PMC article.
-
Unique Ca2+-Cycling Protein Abundance and Regulation Sustains Local Ca2+ Releases and Spontaneous Firing of Rabbit Sinoatrial Node Cells.Int J Mol Sci. 2018 Jul 25;19(8):2173. doi: 10.3390/ijms19082173. Int J Mol Sci. 2018. PMID: 30044420 Free PMC article. Review.
-
Regulation of basal and reserve cardiac pacemaker function by interactions of cAMP-mediated PKA-dependent Ca2+ cycling with surface membrane channels.J Mol Cell Cardiol. 2009 Oct;47(4):456-74. doi: 10.1016/j.yjmcc.2009.06.014. Epub 2009 Jun 30. J Mol Cell Cardiol. 2009. PMID: 19573534 Free PMC article. Review.
Cited by
-
β-Adrenergic Stimulation Synchronizes a Broad Spectrum of Action Potential Firing Rates of Cardiac Pacemaker Cells toward a Higher Population Average.Cells. 2021 Aug 18;10(8):2124. doi: 10.3390/cells10082124. Cells. 2021. PMID: 34440893 Free PMC article.
-
The Autonomic Nervous System Regulates the Heart Rate through cAMP-PKA Dependent and Independent Coupled-Clock Pacemaker Cell Mechanisms.Front Physiol. 2016 Sep 27;7:419. doi: 10.3389/fphys.2016.00419. eCollection 2016. Front Physiol. 2016. PMID: 27729868 Free PMC article.
-
Muscarinic-activated potassium current mediates the negative chronotropic effect of pilocarpine on the rabbit sinoatrial node.Pflugers Arch. 2011 Aug;462(2):235-43. doi: 10.1007/s00424-011-0962-1. Epub 2011 Apr 13. Pflugers Arch. 2011. PMID: 21487692
-
Positive Feedback Mechanisms among Local Ca Releases, NCX, and ICaL Ignite Pacemaker Action Potentials.Biophys J. 2018 Mar 13;114(5):1176-1189. doi: 10.1016/j.bpj.2017.12.043. Biophys J. 2018. PMID: 29539403 Free PMC article.
-
Spontaneous, local diastolic subsarcolemmal calcium releases in single, isolated guinea-pig sinoatrial nodal cells.PLoS One. 2017 Sep 25;12(9):e0185222. doi: 10.1371/journal.pone.0185222. eCollection 2017. PLoS One. 2017. PMID: 28945810 Free PMC article.
References
-
- Beau SL, Hand DE, Schuessler RB, Bromberg BI, Kwon B, Boineau JP, Saffitz JE. Relative densities of muscarinic cholinergic and beta-adrenergic receptors in the canine sinoatrial node and their relation to sites of pacemaker activity. Circ Res 77: 957–963, 1995. - PubMed
-
- Bogdanov KY, Maltsev VA, Vinogradova TM, Lyashkov AE, Spurgeon HA, Stern MD, Lakatta EG. Membrane potential fluctuations resulting from submembrane Ca2+ releases in rabbit sinoatrial nodal cells impart an exponential phase to the late diastolic depolarization that controls their chronotropic state. Circ Res 99: 979–987, 2006. - PubMed
-
- Bogdanov KY, Vinogradova TM, Lakatta EG. Sinoatrial nodal cell ryanodine receptor and Na(+)-Ca(2+) exchanger: molecular partners in pacemaker regulation. Circ Res 88: 1254–1258, 2001. - PubMed
-
- Bolter CP, English DJ. The effects of tertiapin-Q on responses of the sinoatrial pacemaker of the guinea-pig heart to vagal nerve stimulation and muscarinic agonists. Exp Physiol 93: 53–63, 2008. - PubMed
Publication types
MeSH terms
Substances
Grants and funding
LinkOut - more resources
Full Text Sources
Miscellaneous