. 2009 Aug;297(2):H802-10.
doi: 10.1152/ajpheart.00318.2009. Epub 2009 Jun 19.

Mechanical stress analysis of a rigid inclusion in distensible material: a model of atherosclerotic calcification and plaque vulnerability

Affiliations

Mechanical stress analysis of a rigid inclusion in distensible material: a model of atherosclerotic calcification and plaque vulnerability

Tetsuya Hoshino et al. Am J Physiol Heart Circ Physiol. 2009 Aug.

Abstract

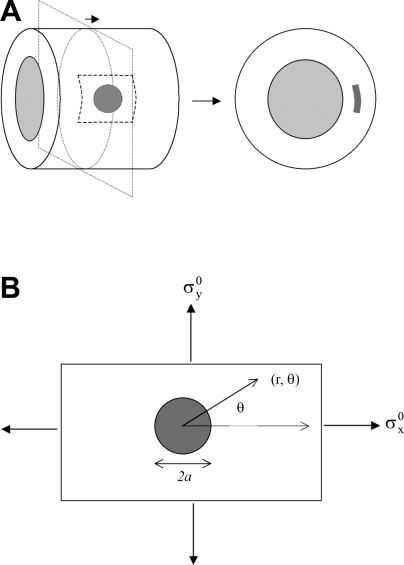
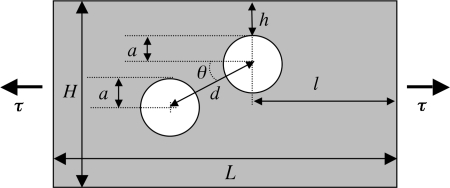
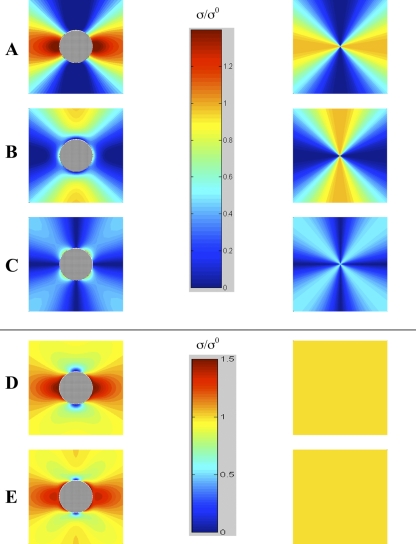
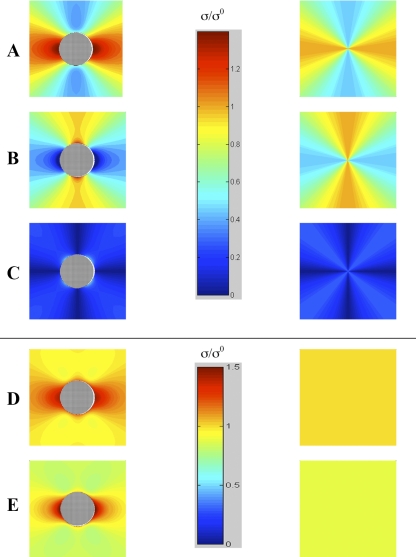
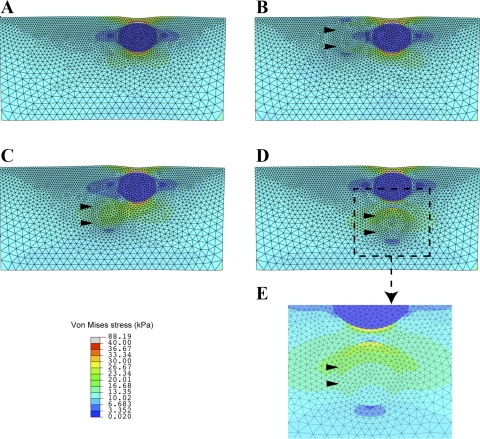
The role of atherosclerotic calcification in plaque rupture remains controversial. In previous analyses using finite element model analysis, circumferential stress was reduced by the inclusion of a calcium deposit in a representative human anatomical configuration. However, a recent report, also using finite element analysis, suggests that microscopic calcium deposits increase plaque stress. We used mathematical models to predict the effects of rigid and liquid inclusions (modeling a calcium deposit and a lipid necrotic core, respectively) in a distensible material (artery wall) on mechanical failure under uniaxial and biaxial loading in a range of configurations. Without inclusions, stress levels were low and uniform. In the analytical model, peak stresses were elevated at the edges of a rigid inclusion. In the finite element model, peak stresses were elevated at the edges of both inclusions, with minimal sensitivity to the wall distensibility and the size and shape of the inclusion. Presence of both a rigid and a soft inclusion enlarged the region of increased wall stress compared with either alone. In some configurations, the rigid inclusion reduced peak stress at the edge of the soft inclusion but simultaneously increased peak stress at the edge of the rigid inclusion and increased the size of the region affected. These findings suggest that the presence of a calcium deposit creates local increases in failure stress, and, depending on relative position to any neighboring lipid pools, it may increase peak stress and the plaque area at risk of mechanical failure.


Figures

Fig. 1.
Fig. 1.
Schematic diagram of the hypothetical model used to assess mechanical stress around a calcium deposit in a distensible vessel. A: the cylinder (left) represents a model vascular segment. The shaded circle represents a calcium deposit, simplified to a thin circular disc. The dashed square represents the region evaluated for mechanical stress, including both vessel and deposit. A cross-sectional view is shown on the right. The shaded pattern on the right corresponds with the dashed square on the left. B: the rectangle corresponds with the shaded square in A. Polar coordinates (r, θ), diameter of the deposit (2a), and orientation of stresses (σyo} and σxo) are indicated.
Fig. 2.
Fig. 2.
Schematic of finite element model. All parameters were varied over a specified range (some results not shown); values from the simulations presented in Fig. 5 are as follows: the inclusion diameter, a = 0.3 mm; the distance of the soft (lipidic) inclusion to the lumen, h = 0.05 mm; the distance between inclusions, d = 0.36 mm; height and width of the entire model, H = 1 mm and L = 1.95 mm; and the applied tension, τ = 10 kPa.
Fig. 3.
Fig. 3.
Stress distribution for uniaxial loading of distensible material with (left) and without (right) a rigid inclusion. Radial (A), circumferential (B), shear (C), normalized maximum principal (D), and von Mises (E) stresses. Vertical bars are pseudocolor scales for stress σ, normalized to the applied stress σ0 in AC and separately for stress in D and E (ν = 0.45).
Fig. 4.
Fig. 4.
Stress distribution for biaxial loading of distensible material with a rigid inclusion (left) and without (right). Radial (A), circumferential (B), shear (C), normalized maximum principal (D), and von Mises (E) stresses. Vertical bars are pseudocolor scales for stress σ, normalized to the applied stress σ0 in AC and separately for stress in D and E (ν = 0.45).
Fig. 5.
Fig. 5.
Von Mises stress distributions computed by finite element analysis. A uniform tension load of τ = 10 kPa was applied to the left and right edges to model the circumferential stress in the arterial wall, and the resulting deformation and stress states were computed by using the hyperelastic constitutive model described in the text. A: with only a soft (lipidic) inclusion and no stiff (calcific) inclusion. B: soft inclusion with neighboring stiff inclusion (arrowheads) equidistant from the lumen (θ = 0°). C: soft inclusion with stiff inclusion to one side and at greater distance from the lumen (θ = 45°). D: stiff inclusion abluminal to the soft inclusion (θ = 90°). E: magnified view of D focusing on a region of nominally high stress.
Fig. 6.
Fig. 6.
Biological models. A: in vitro model showing failure at the edge of a calcified nodule in a culture of calcifying vascular cells, containing mineralized nodules on a lawn of monolayer cells and extracellular matrix. Representative example of 3 cultures tested. Double-headed arrow indicates stress loading axis. Arrowheads indicate the calcified nodule, and distance between arrowheads is ∼2 mm. B: ex vitro model showing failure at the edge of a calcified lesion in the Oil Red O stained ascending aorta from a hyperlipidemic (high fat-fed ldlr−/−) mouse following uniaxial loading. Representative example of 3 aortas tested. Double-headed arrow indicates stress loading axis. Great arteries and aortic arch (cephalad) are on the left. Arrowheads indicate torn edges. Scale bar = 1 mm. C: intravascular ultrasound images of atherosclerotic calcification in a human coronary artery obtained before and after intraluminal balloon inflation. After balloon inflation, failure (dashed arrow) is seen at the edge of the calcium deposit (solid arrows). Scale bar = 1 mm. D: Von Kossa staining of calcified human coronary artery after intraluminal balloon inflation. A circumferential arc of calcification (arrowheads) is seen in the vessel wall, with failure (arrow) seen at the end of the calcified arc facing the direction of the applied stress where compliance mismatch would be expected. Scale bar = 0.5 mm.

References

    1. Arad Y, Spadaro LA, Roth M, Scordo J, Goodman K, Sherman S, Lledo A, Lerner G, Guerci AD. Correlations between vascular calcification and atherosclerosis: a comparative electron beam CT study of the coronary and carotid arteries. J Comput Assist Tomogr 22: 207–211, 1998. - PubMed
    1. Band W, Goedhard WJ, Knoop AA. Comparison of effects of high cholesterol intake on viscoelastic properties of the thoracic aorta in rats and rabbits. Atherosclerosis 18: 163–171, 1973. - PubMed
    1. Beckman JA, Ganz J, Creager MA, Ganz P, Kinlay S. Relationship of clinical presentation and calcification of culprit coronary artery stenoses. Arterioscler Thromb Vasc Biol 21: 1618–1622, 2001. - PubMed
    1. Buerger L, Oppenheimer A. Bone formation in sclerotic arteries. J Exp Med 10: 354–367, 1908. - PMC - PubMed
    1. Bunting CH The formation of true bone with cellular (red) marrow in a sclerotic aorta. J Exp Med 8: 365–376, 1906. - PMC - PubMed

Publication types