Solution structure of human cardiac troponin C in complex with the green tea polyphenol, (-)-epigallocatechin 3-gallate
- PMID: 19542563
- PMCID: PMC2755708
- DOI: 10.1074/jbc.M109.021352
Solution structure of human cardiac troponin C in complex with the green tea polyphenol, (-)-epigallocatechin 3-gallate
Abstract
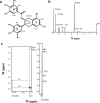
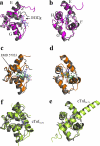
Heart muscle contraction is regulated by Ca(2+) binding to the thin filament protein troponin C. In cardiovascular disease, the myofilament response to Ca(2+) is often altered. Compounds that rectify this perturbation are of considerable interest as therapeutics. Plant flavonoids have been found to provide protection against a variety of human illnesses such as cancer, infection, and heart disease. (-)-Epigallocatechin gallate (EGCg), the prevalent flavonoid in green tea, modulates force generation in isolated guinea pig hearts (Hotta, Y., Huang, L., Muto, T., Yajima, M., Miyazeki, K., Ishikawa, N., Fukuzawa, Y., Wakida, Y., Tushima, H., Ando, H., and Nonogaki, T. (2006) Eur. J. Pharmacol. 552, 123-130) and in skinned cardiac muscle fibers (Liou, Y. M., Kuo, S. C., and Hsieh, S. R. (2008) Pflugers Arch. 456, 787-800; and Tadano, N., Yumoto, F., Tanokura, M., Ohtsuki, I., and Morimoto, S. (2005) Biophys. J. 88, 314a). In this study we describe the solution structure of the Ca(2+)-saturated C-terminal domain of troponin C in complex with EGCg. Moreover, we show that EGCg forms a ternary complex with the C-terminal domain of troponin C and the anchoring region of troponin I. The structural evidence indicates that the binding site of EGCg on the C-terminal domain of troponin C is in the hydrophobic pocket in the absence of troponin I, akin to EMD 57033. Based on chemical shift mapping, the binding of EGCg to the C-terminal domain of troponin C in the presence of troponin I may be to a new site formed by the troponin C.troponin I complex. This interaction of EGCg with the C-terminal domain of troponin C.troponin I complex has not been shown with other cardiotonic molecules and illustrates the potential mechanism by which EGCg modulates heart contraction.
Figures


Similar articles
-
The green tea polyphenol (-)-epigallocatechin-3-gallate inhibits magnesium binding to the C-domain of cardiac troponin C.J Muscle Res Cell Motil. 2013 May;34(2):107-13. doi: 10.1007/s10974-013-9338-9. Epub 2013 Feb 18. J Muscle Res Cell Motil. 2013. PMID: 23417789 Free PMC article.
-
A computational exploration of the interactions of the green tea polyphenol (-)-Epigallocatechin 3-Gallate with cardiac muscle troponin C.PLoS One. 2013 Jul 29;8(7):e70556. doi: 10.1371/journal.pone.0070556. Print 2013. PLoS One. 2013. PMID: 23923004 Free PMC article.
-
Biological actions of green tea catechins on cardiac troponin C.Br J Pharmacol. 2010 Nov;161(5):1034-43. doi: 10.1111/j.1476-5381.2010.00942.x. Br J Pharmacol. 2010. PMID: 20977454 Free PMC article.
-
Mechanism of Creaming Down Based on Chemical Characterization of a Complex of Caffeine and Tea Catechins.Chem Pharm Bull (Tokyo). 2016;64(7):676-86. doi: 10.1248/cpb.c16-00131. Chem Pharm Bull (Tokyo). 2016. PMID: 27373623 Review.
-
Effects of Green Tea (-)-Epigallocatechin-3-Gallate (EGCG) on Cardiac Function - A Review of the Therapeutic Mechanism and Potentials.Mini Rev Med Chem. 2022;22(18):2371-2382. doi: 10.2174/1389557522666220328161826. Mini Rev Med Chem. 2022. PMID: 35345998 Review.
Cited by
-
Structure of trans-resveratrol in complex with the cardiac regulatory protein troponin C.Biochemistry. 2011 Mar 1;50(8):1309-20. doi: 10.1021/bi101985j. Epub 2011 Jan 27. Biochemistry. 2011. PMID: 21226534 Free PMC article.
-
Green tea extract given before regional myocardial ischemia-reperfusion in rats improves myocardial contractility by attenuating calcium overload.Pflugers Arch. 2010 Nov;460(6):1003-14. doi: 10.1007/s00424-010-0881-6. Epub 2010 Oct 5. Pflugers Arch. 2010. PMID: 20922441
-
Muscle dysfunction in hypertrophic cardiomyopathy: what is needed to move to translation?J Muscle Res Cell Motil. 2014 Feb;35(1):37-45. doi: 10.1007/s10974-014-9374-0. Epub 2014 Feb 4. J Muscle Res Cell Motil. 2014. PMID: 24493262 Free PMC article. Review.
-
Polyphenols as potential enhancers of stem cell therapy against neurodegeneration.Neural Regen Res. 2022 Oct;17(10):2093-2101. doi: 10.4103/1673-5374.335826. Neural Regen Res. 2022. PMID: 35259814 Free PMC article. Review.
-
Green Tea Polyphenols in drug discovery - a success or failure?Expert Opin Drug Discov. 2011 Jun;6(6):589-595. doi: 10.1517/17460441.2011.570750. Expert Opin Drug Discov. 2011. PMID: 21731575 Free PMC article.
References
-
- Rosamond W., Flegal K., Furie K., Go A., Greenlund K., Haase N., Hailpern S. M., Ho M., Howard V., Kissela B., Kittner S., Lloyd-Jones D., McDermott M., Meigs J., Moy C., Nichol G., O'Donnell C., Roger V., Sorlie P., Steinberger J., Thom T., Wilson M., Hong Y. (2008) Circulation 117,e25–e146 - PubMed
-
- Parmacek M. S., Solaro R. J. (2004) Prog. Cardiovasc. Dis. 47,159–176 - PubMed
-
- Li M. X., Wang X., Sykes B. D. (2004) J. Muscle Res. Cell Motil. 25,559–579 - PubMed
-
- Tobacman L. S. (1996) Annu. Rev. Physiol. 58,447–481 - PubMed
-
- Gomes A. V., Potter J. D., Szczesna-Cordary D. (2002) IUBMB Life 54,323–333 - PubMed
Publication types
MeSH terms
Substances
Associated data
- Actions
LinkOut - more resources
Full Text Sources
Miscellaneous

