. 2009 Jul;11(7):881-9.
doi: 10.1038/ncb1897. Epub 2009 Jun 21.

TGF-beta activates Akt kinase through a microRNA-dependent amplifying circuit targeting PTEN

Affiliations

TGF-beta activates Akt kinase through a microRNA-dependent amplifying circuit targeting PTEN

Mitsuo Kato et al. Nat Cell Biol. 2009 Jul.

Abstract

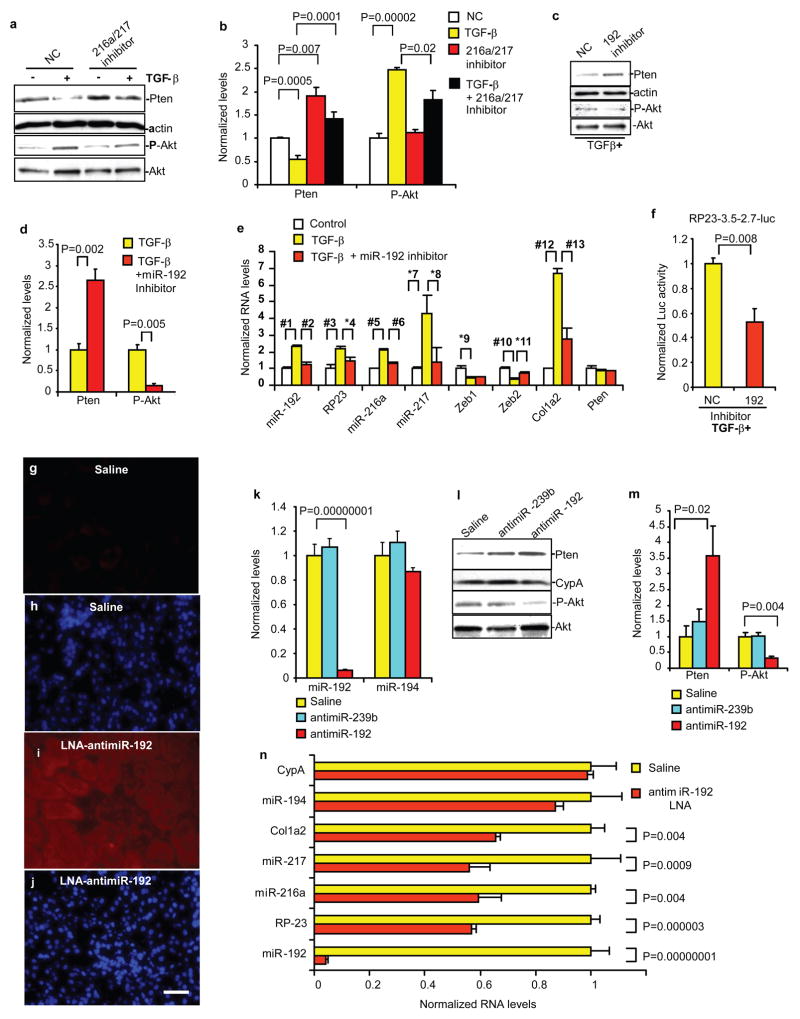
Akt kinase is activated by transforming growth factor-beta1 (TGF-beta) in diabetic kidneys, and has important roles in fibrosis, hypertrophy and cell survival in glomerular mesangial cells. However, the mechanisms of Akt activation by TGF-beta are not fully understood. Here we show that TGF-beta activates Akt in glomerular mesangial cells by inducing the microRNAs (miRNAs) miR-216a and miR-217, both of which target PTEN (phosphatase and tensin homologue), an inhibitor of Akt activation. These miRNAs are located within the second intron of a non-coding RNA (RP23-298H6.1-001). The RP23 promoter was activated by TGF-beta and miR-192 through E-box-regulated mechanisms, as shown previously. Akt activation by these miRs led to glomerular mesangial cell survival and hypertrophy, which were similar to the effects of activation by TGF-beta. These studies reveal a mechanism of Akt activation through PTEN downregulation by two miRs, which are regulated by upstream miR-192 and TGF-beta. Due to the diversity of PTEN function, this miR-amplifying circuit may have key roles, not only in kidney disorders, but also in other diseases.


Figures

Figure 1
Figure 1. Expression and genomic organizations of miR-216a and miR-217
a, Dose response of TGF-β (24hr) on miRs and related genes in MMC (qPCR data, *, p<0.05; #, p<0.01 vs control, n=3). See Fig. S1 for details. b, Time course of TGF-β effects in MMC (qPCRs, *, p<0.05; #, p<0.01, n=3). See Fig. S1 for details. c, Real time qPCRs showing significant increases in miR-216a and miR-217 levels in glomeruli of STZ-injected type 1, and db/db type 2 diabetic mice (n=4). d, Schematic representation of mouse non-coding RNA RP23-298H6.1-001 genomic region showing miR-216a and miR-217 locations in the second intron, with upstream CAGAs and E-box clusters. e, Genomic structure of the upstream region of the RP23 gene. CAGA repeats (blue triangles) and potential E-boxes (red diamonds) are found in the 2–5kb upstream region. f, Basal activity of RP23 promoter regions and response to TGF-β −4.8k and −3.5k constructs, but not −2.7k, responded to TGF-β (n=4). g, Response of deletion mutants of the −4.8–2.7k region to TGF-β,( n=4). −4.8–3.5k region includes three E-boxes and ten CAGAs while −3.5–2.7k region has four E-boxes and eight CAGAs. Significant increase in Luc activity of the 3.5–2.7k construct was observed but no change with −4.8–3.5k region (n=4). TGF-β had similar effects in the RP23-3.5-2.7k, 2xE-boxes and 1xE-box constructs. One E-box in the most proximal part of −3.5–2.7k was sufficient for TGF-β response. Mutation of this proximal E-box abrogated the TGF-β response. h, qPCRs showing that miR-192 mimic (10 nM) decreased the expression of Zeb2 and reciprocally increased RP23, miR-216a and miR-217 levels (n=3). i, qPCRs showing that, similar to miR-192, ON-TARGETplus SMART pool Zeb2 siRNA (10 nM) decreased the expression of Zeb2 but increased RP23, miR-216a and miR-217 levels (n=3). j, miR-192 mimic (10 nM) or SMART pool Zeb2 siRNA(10nM) increased Luc activity of RP23-3.5-2.7k-luc (n=4). NC, negative control. Bar graph data expressed as mean and s.e.m.
Figure 2
Figure 2. Pten is a direct target of miR-216a and miR-217
a, Alignment of human and mouse miR-216a or miR-217 with Pten 3′UTR sequences. Seed regions of these miRs are completely complementary to target sites in the Pten 3′UTR. Target sequences are highly conserved from human and mouse. Numbers next to the PTEN 3′UTR sequence are relative to 3′ UTR start sites. b–d, Immunostaining of Pten in mouse renal sections. Pten levels in glomeruli from db/db diabetic mice (c) were significantly lower than control db/+ (b) (n=3). Scale bar, 20 μm. e–g,j, Pten protein levels in MMC treated for 24 hr with TGF-β or HG (n=3) (e), for 48 hr with miR-216a mimic (10nM)(n=3)(f), miR-217 alone or with miR-216a (n=3) (g), miR-216a, miR-217 or miR-192 mimics (n=4) (j). h,i, Phospho-Akt levels in MMC treated for 24 hr with TGF-β (n=3) (h), for 48 hr with miR-216a, miR-217 or miR-192 mimics (10nM)(n=4) (i). k, Luc reporters containing full-length (6k) or shorter (1.4k) Pten 3′UTR, and mutants of miR-216a and miR-217 target sites (SVP, SV40 promoter). miR-216a and miR-217 mimics (10nM) significantly inhibited Pten 3′UTR Luc (full) activity relative to negative control (NC). The shorter 1.4k construct (WT) which includes the miR-216a and miR-217 target sites showed similar responses as full-length. miR-216a site mutant still responded to miR-217 but not to miR-216a, and vice versa. The double mutant did not respond to either of the miR mimics. Mean and s.e.m. (n=4). See also Fig. S4a for details of Pten 3′UTR constructs. l, Effects of TGF-β and miR-216a inhibitor on the Pten 3′UTR reporters. Plasmid containing luciferase fused to Pten 3′UTR (miR-216a target site) was used as reporter (Pten 3′UTR-S). Significant decrease in reporter activity was detected with Pten 3′UTR-S by TGF-β (n=4) and this was reversed by 10 nM miR-216a inhibitor (n=4). m, TGF-β significantly decreased Pten 3′UTR-S (miR-217 site) reporter activity (n=4), and this was reversed by 5 nM miR-217 inhibitor (n=4). See also Fig. S4. Bar graph data expressed as mean and s.e.m. Full or larger scan blots of e–j are shown in Supplementary Fig. S7.
Figure 3
Figure 3. Effects of miR inhibitors on downstream signaling in vitro and in vivo
a,b, Effects of miR-216a and miR-217 inhibitors (10nM) on endogenous Pten, P-Akt levels (Western blots) in MMC treated with or without TGF-β. NC, negative control (n=3). c,d, Effects of miR-192 inhibitor (10nM) on TGF-β induced effects on Pten and P-Akt in MMC. MMC were transfected with inhibitors and then treated with TGF-β, followed by Western blotting (n=3). e, Effects of miR-192 inhibitor on endogenous RNA levels of miR-192, RP23, miR-216a, miR-217, Zeb1, Zeb2, Col1a2 and Pten in MMC treated with TGF-β (qPCRs, *, p<0.05; #, p<0.01, n=3). #1, p=0.005; #2, p=0.001; #3, p=0.001; *4, p=0.02; #5, p=0.006; #6, p=0.0007; *7, p=0.02; *8, p=0.02; *9, p=0.04; #10, p=0.01; *11, p=0.02; #12, p=0.002; #13, p=0.003. f, Effects of miR-192 inhibitor on TGF-β-induced RP23 promoter (RP23-3.5-2.7k-luc) activity in MMC (n=4). g–j, In vivo delivery of LNA-antimiR-192. LNA-antimiR-192 was subcutaneously injected (2.5 mg/kg) into normal C57BL/6 mice and renal cortical tissues harvested 6hr later. Representative data of in-situ hybridization to detect LNA-antimiR-192 in mouse renal cortical sections 6hr after injections. Very feeble fluorescence was detected in the kidney of control vehicle saline-injected mice (saline, g). Intense and widespread fluorescence in kidney glomerular and tubular compartments was observed in LNA-antimiR-192 injected mice (i). DAPI staining of kidney cortex of saline and LNA-antimiR-192 injected mice respectively (h,j). Scale bar, 20 μm. k, qPCRs of cortical tissues obtained from normal C57BL/6 mice injected subcutaneously with 2.5 mg/kg LNA-antimiR-192, LNA-antimiR-239b (targeting C. elegans miR-239b) or saline. Significant decrease in RNA levels of miR-192, but not miR-194, was observed with LNA-antimiR-192, while no change with saline or LNA-antimiR-239b. l,m, Concomitant significant increase in Pten protein levels and decrease in P-Akt levels (P-Akt to total Akt ratios) by LNA-antimiR-192 but not by LNA-antimiR-239b. n, Significant decrease in RNA levels of miR-192, RP23, miR-216a, miR-217, and Col1a2, but no change in miR-194 or CypA in LNA anti-miR-192 injected mice. (n=3). Bar graph data expressed as mean and s.e.m. Full or larger scan blots of a,c,l are shown in Supplementary Fig. S7.
Figure 4
Figure 4. Effects of miR-192 and miR-216a/217 on Akt downstream targets
a. Blots showing that miR-192 and miR-216/217 mimics (10nM) induced phosphorylation of Akt targets, FoxO3a, mTOR and GSK3β similar to the actions of TGF-β miR inhibitors (10nM) blocked or attenuated TGF-β effects. Actin and total FoxO3a used as loading controls. b–d. Bar graph quantifications show increased phosphorylation of FoxO3a (P-FoxO3a) (b), mTOR (P-mTOR) (c) and GSK3β (P-GSK3β) (d) in MMC treated with TGF-β, miR-192 and miR-216a/217 mimics and attenuation by the miR-192 or miR-216a/217 inhibitors (n=3). e, Cellular localization of FoxO3a in MMC. Left panels in each treatment show FoxO3a-GFP cellular localization. Right panels show Hoechst staining (nuclear). Serum depletion induced nuclear localization of FoxO3a and TGF-β reversed this localization to the cytoplasm. miR-192 and miR-216a/217 mimics induced cytoplasmic translocation of FoxO3a similar to TGF-β. Conversely, inhibitors of these miRs relocated FoxO3a into the nucleus in TGF-β– treated cells. Scale bar, 20 μm. f, Cells with cytoplasmic or nuclear localization were counted in three fields and the results depicted in the bar graph as percentage of cells with cytoplasmic fluorescence relative to total (n=3). FoxO3a was localized in the cytoplasm in 96% of cells under normal culture conditions (Serum +). However, after serum depletion (SD), 96% of cells had nuclear FoxO3a (4% in cytoplasm). FoxO3a translocated back to the cytoplasm upon treatment with miR-192 (76%) or miR- 216a/217 (90%) mimic, or TGF-β (95%). miR-192 or miR216a/217 inhibitor significantly attenuated cytoplasmic FoxO3a to 71% or 64% respectively in TGF-β– treated cells. Bar graph data expressed as mean and s.e.m. Full or larger scan blots of a are shown in Supplementary Fig. S7.
Figure 5
Figure 5. Effects of miR-192 and miR-216a/217 on FoxO3a activity, MMC apoptosis and hypertrophy
a, FoxO3a function was monitored by pFRE-luc. Luc activity was decreased by TGF-β. miR-192 and miR-216a/217 mimics (10nM) decreased reporter activity similar to TGF-β (n=4). b, Inhibitors (10nM) of miR-192 and miR-216a/217 increased basal activity of pFRE-luc and also restored the reporter activity inhibited by TGF-β (n=4). c, In serum-depleted cells, Bim expression levels (qPCRs) were decreased by miR-192 and miR-216a/217 mimics as well as TGF-β. Inhibitors of miR-192 and miR-216a/217 reversed the inhibitory effect of TGF-β on Bim expression (n=3). d, TGF-β, as well as miR-192 and miR-216/217 mimics, reduced serum depletion-induced apoptosis of MMC. Inhibitors of miR-192 and miR-216a/217 reversed the inhibitory effect of TGF-β (n=4). e, Cellular protein levels were calculated as ratio of total protein amount/total cell number. Protein levels (hypertrophy) were increased by TGF-β in serum-depleted cells. miR-192 and miR-216a/217 mimics induced hypertrophy to the same extent as TGF-β. Conversely, inhibitors of miR-192 and miR-216a/217 attenuated TGF-β-induced hypertrophy (n=3). Bar graph data expressed as mean and s.e.m. f, Schematic model of miR-dependent amplifying mechanisms in the pathogenesis of DN. TGF-β induced by diabetic conditions upregulates miR-192 which targets Zeb2. The ensuing decrease in Zeb2 upregulates the expression of RP23 which hosts miR-216a and miR-217, both of which target PTEN. The decrease in PTEN increases PIP3 and Akt activation, leading to the phosphorylation of Akt target proteins and increased MMC survival, oxidant stress, ECM expression and hypertrophy, major features of DN.

References

    1. Yamamoto T, Nakamura T, Noble NA, Ruoslahti E, Border WA. Expression of transforming growth factor beta is elevated in human and experimental diabetic nephropathy. Proc Natl Acad Sci U S A. 1993;90:1814–1818. - PMC - PubMed
    1. Sharma K, Ziyadeh FN. Hyperglycemia and diabetic kidney disease. The case for transforming growth factor-beta as a key mediator. Diabetes. 1995;44:1139–1146. - PubMed
    1. Kato M, et al. MicroRNA-192 in diabetic kidney glomeruli and its function in TGF-beta-induced collagen expression via inhibition of E-box repressors. Proc Natl Acad Sci U S A. 2007;104:3432–3437. - PMC - PubMed
    1. Kato M, et al. Role of the Akt/FoxO3a pathway in TGF-beta1-mediated mesangial cell dysfunction: a novel mechanism related to diabetic kidney disease. J Am Soc Nephrol. 2006;17:3325–3335. - PubMed
    1. Mahimainathan L, Das F, Venkatesan B, Choudhury GG. Mesangial cell hypertrophy by high glucose is mediated by downregulation of the tumor suppressor PTEN. Diabetes. 2006;55:2115–2125. - PubMed

Publication types

MeSH terms