. 2009 Aug;10(8):823-30.
doi: 10.1038/ni.1761. Epub 2009 Jun 21.

The impact of negative selection on thymocyte migration in the medulla

Affiliations

The impact of negative selection on thymocyte migration in the medulla

Marie Le Borgne et al. Nat Immunol. 2009 Aug.

Abstract

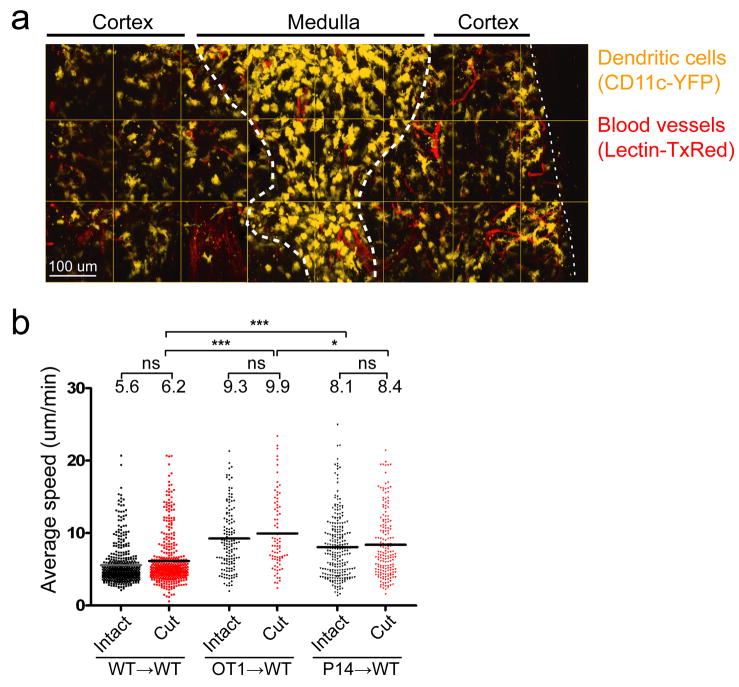
Developing thymocytes are screened for self-reactivity before they exit the thymus, but how thymocytes scan the medulla for self antigens is unclear. Using two-photon microscopy, we observed that medullary thymocytes migrated rapidly and made frequent, transient contacts with dendritic cells. In the presence of a negative selecting ligand, thymocytes slowed, became confined to areas of approximately 30 microm in diameter and had increased contact with dendritic cells surrounding confinement zones. One third of polyclonal medullary thymocytes also showed confined, slower migration and may correspond to autoreactive thymocytes. Our data suggest that many autoreactive thymocytes do not undergo immediate arrest and death after encountering a negative selecting ligand but instead adopt an altered migration program while remaining in the medullary microenvironment.


Figures

Figure 1
Figure 1. Sectioning the thymus facilitates imaging of the medulla
a. The thymus of a CD11c-YFP+ mouse, injected with lectin-Texas Red before sacrifice to label blood vessels, was cut and imaged by two-photon microscopy. Image shows a montage of maximal projections of adjacent 3D data sets spanning the cut thymus from the dorsal to the ventral side. Scale bar indicates 100 μm. Image is representative of more that 20 cut thymuses. b. Plot shows the average speed of individual thymocyte tracks in the cortex of an intact or a cut thymic lobe. Each dot represents the average speed of an individual track. For each population, the mean average speed is listed at the top of each column. This analysis was based on data for at least 3 individual chimeras with 449 WT → WT tracks from intact thymic lobes and 443 from cut thymic lobes, 142 OT1 → WT tracks from intact thymic lobes and 88 tracks from cut thymic lobes, and 244 P14 → WT tracks from intact thymic lobes and 174 tracks from cut thymic lobes. ns (not significant), P > 0.05;*, 0.01<P<0.05;***, P<0.001.
Figure 2
Figure 2. Thymocyte migration in the medulla is rapid and confined
a. Representative stills of two-photon imaging volumes in the cortex or the medulla of a cut thymic lobe with WT CFP-labeled thymocytes and CD11c-YFP+ DCs. Three representative tracks with the duration of 10.4 min are color-coded for time (blue > red > yellow). White arrows indicate donor-derived, CFP+ DCs. Scale bar indicates 30μm. b. Each dot represents the average speed of an individual tracked thymocyte, in the cortex or the medulla of WT → WT, OT1 → WT or P14 → WT chimeras. At the top of each column, the mean average_speed is listed for each population. This analysis was based on data for 443 WT → WT cortical tracks from 6 chimeras, 505 WT → WT medullary tracks from 6 chimeras, 80 OT1 → WT cortical tracks from 3 chimeras, 183 OT1 → WT medullary tracks from 3 chimeras, 174 P14 → WT cortical tracks from 3 chimeras, and 171 P14 → WT medullary tracks from 3 chimeras. ns, P > 0.05;***, P<0.001. c. The average displacement from origin is plotted as a function of the square root of time for representative runs from indicated chimeras. Graphical view of linear regression analysis for the sloped regions of each plot (black dotted line) and the estimated plateaus (red dotted line) are shown. Error bars indicate s.e.m.
Figure 3
Figure 3. The impact of negative selection on thymocyte migration
a. Two-photon imaging volumes in the medulla show CD11c-YFP+ cells and 3 representative OT1 thymocyte tracks with durations of 12.5 min in hosts without or with OVA. Scale bar indicates 30 μm. b. Average speeds of OT1 thymocytes in the cortex and the medulla in hosts with or without OVA. For each population, mean average speeds is indicated at the top of each column. Runs from 3 OT1+WT → −OVA chimeras (80 cortical tracks and 183 medullary tracks) and 5 OT1+WT → +OVA chimeras (105 cortical tracks and 187 medullary tracks) were analyzed. ns, P > 0.05;***, P < 0.001. c. Compiled data from the medulla showing the mean average speed for OT1 thymocytes versus WT thymocytes from the same run. Each dot represents an individual imaging volume from OT1+WT → − OVA chimeras and OT1+WT → +OVA chimeras. d. Left plot shows average displacement from origin against the square root of time for WT and OT1 thymocytes for a representative OT1+WT → +OVA chimera. Black dotted lines indicate plateau values and error bars indicate s.e.m. OT1 thymocyte tracks are shown with polyclonal thymocytes tracks (middle panel) or CD11c-YFP-labeled DCs (right panel). e. Graph shows confinement distances of WT and OT1 thymocytes from WT+OT1 → +OVA chimeras (lines connect values from the same imaging volumes) and OT1 → −OVA chimeras. *, 0.01<P<0.05;**, 0.001<P<0.01. f. Migration of auto-reactive thymocytes from OT1+WT → +OVA chimeras into and out of confinement zones. Horizontal lines represent 67 OT1 thymocytes (5 runs) whose tracks defined 17 confinement zones (A–Q).
Figure 4
Figure 4. Increased thymocyte-DC interactions during negative selection
a. Examples of OT1 GFP thymocytes that make successive interactions with CD11c-YFP+ DCs in hosts in the presence or absence of OVA. Thymocyte tracks are color-coded to indicate the passage of time (blue at the start of imaging to white at the end). Thymocyte-DC contacts are indicated with a black arrowhead while the absence of a contact is indicated with a white arrowhead. Close contacts in OT1 thymocyte from OT1 → −OVA chimeras are shown with a black arrow while red arrowheads in OT1 thymocyte from OT1 → +OVA chimeras indicate long lasting contact with a DC. b–c. Interactions between DCs and OT1 thymocytes in the medulla in the presence or absence of OVA. Tracks for individual thymocytes were monitored in intervals of 25 seconds, and the number of time points during which each thymocyte contacted a DC was recorded. The graphs show (b) the relative frequency of contacts of indicated duration, and (c) the percent of time each thymocyte spent in contact with DCs. Mean values listed at top of graph. P > 0.05;*, 0.01<P<0.05;***, P<0.001. d. Compiled data showing the mean % of time that wild-type thymocytes spent in contact with DCs versus the mean % of time that OT1 thymocytes spent in contact with DCs in the same imaging volume. Each dot represents an individual TPSLM run. Imaging volumes from 3 OT1+WT → −OVA chimeras and 5 OT1+WT → +OVA chimeras were analyzed.
Figure 5
Figure 5. A subset of polyclonal medullary thymocytes exhibits slower, more confined migration
a–b. Relative frequency distribution of average speeds of medullary thymocytes from indicated chimeras (a,b) or of GFP+ thymocytes in Foxp3-GFP reporter mice (b). The differences between the mean average speed of WT → WT and WT → MHC-I−/− thymocytes or Foxp3-GFP+ thymocytes were not significant (P > 0.05) whereas the difference between WT → WT and WT → MHC-II−/− thymocytes was significant (P < 0.001). Vertical dotted line indicates the cut-off used to define slow versus fast medullary thymocytes (8 μm/min). Imaging volumes from 3 WT → MHC-I−/− chimeras (204 tracks), 2 WT → MHC-II−/− (196 tracks), 6 WT → WT (183 tracks), and 3 Foxp3-GFP reporter mice (94 tracks) were analyzed. c. Graphs show average displacement against the square root of time of thymocytes in WT + OT1 → +OVA chimeras. Left, wild-type thymocytes with average speeds of ≥8 μm/min, <8 μm/min, or all cells. Right, OT1 thymocytes from the same imaging volumes. Dashed lines indicate estimated plateau of confined migration for each curve. Error bars indicate s.e.m. Plots show tracks of fast and slow WT thymocytes compared to OT1 thymocytes. Scale bar, 30 μm. Imaging volumes from 5 OT1+WT → +OVA chimeras were analyzed. d. Size of confinement distance for WT thymocytes for all tracks, ≥8 μm/min, and <8 μm/min. Data are from 5 WT+OT1 → +OVA and one WT+OT1 → −OVA chimeras. Lines connect values from the same imaging volumes and significance was calculated using paired t-tests. **, 0.001<P<0.01.

Comment in

References

    1. Kyewski B, Klein L. A central role for central tolerance. Annu Rev Immunol. 2006;24:571–606. - PubMed
    1. Anderson MS, et al. Projection of an immunological self shadow within the thymus by the aire protein. Science. 2002;298:1395–1401. - PubMed
    1. Mathis D, Benoist C. Aire. Annu Rev Immunol. 2009;27:287–312. - PubMed
    1. Derbinski J, Schulte A, Kyewski B, Klein L. Promiscuous gene expression in medullary thymic epithelial cells mirrors the peripheral self. Nat Immunol. 2001;2:1032–1039. - PubMed
    1. Anderson MS, et al. The cellular mechanism of Aire control of T cell tolerance. Immunity. 2005;23:227–239. - PubMed

Substances