. 2009 Jun;5(6):e1000479.
doi: 10.1371/journal.ppat.1000479. Epub 2009 Jun 19.

Selective processing and metabolism of disease-causing mutant prion proteins

Affiliations

Selective processing and metabolism of disease-causing mutant prion proteins

Aarthi Ashok et al. PLoS Pathog. 2009 Jun.

Abstract

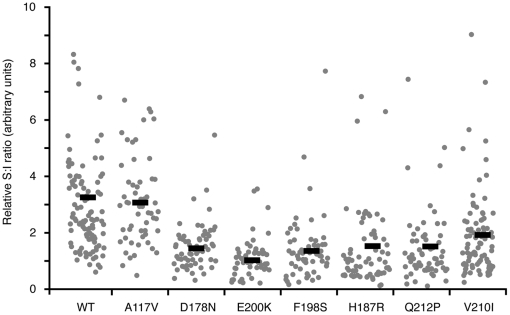
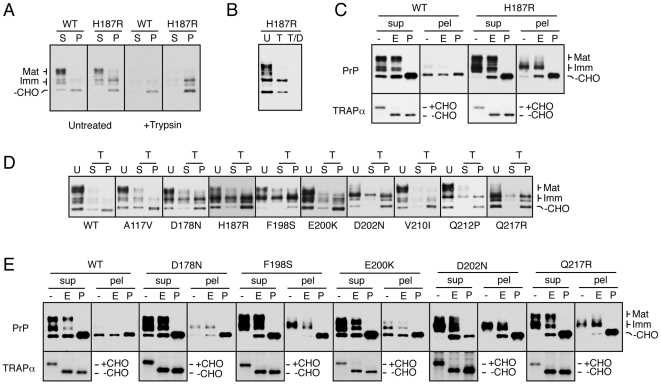
Prion diseases are fatal neurodegenerative disorders caused by aberrant metabolism of the cellular prion protein (PrP(C)). In genetic forms of these diseases, mutations in the globular C-terminal domain are hypothesized to favor the spontaneous generation of misfolded PrP conformers (including the transmissible PrP(Sc) form) that trigger downstream pathways leading to neuronal death. A mechanistic understanding of these diseases therefore requires knowledge of the quality control pathways that recognize and degrade aberrant PrPs. Here, we present comparative analyses of the biosynthesis, trafficking, and metabolism of a panel of genetic disease-causing prion protein mutants in the C-terminal domain. Using quantitative imaging and biochemistry, we identify a misfolded subpopulation of each mutant PrP characterized by relative detergent insolubility, inaccessibility to the cell surface, and incomplete glycan modifications. The misfolded populations of mutant PrPs were neither recognized by ER quality control pathways nor routed to ER-associated degradation despite demonstrable misfolding in the ER. Instead, mutant PrPs trafficked to the Golgi, from where the misfolded subpopulation was selectively trafficked for degradation in acidic compartments. Surprisingly, selective re-routing was dependent not only on a mutant globular domain, but on an additional lysine-based motif in the highly conserved unstructured N-terminus. These results define a specific trafficking and degradation pathway shared by many disease-causing PrP mutants. As the acidic lysosomal environment has been implicated in facilitating the conversion of PrP(C) to PrP(Sc), our identification of a mutant-selective trafficking pathway to this compartment may provide a cell biological basis for spontaneous generation of PrP(Sc) in familial prion disease.


Conflict of interest statement

The authors have declared that no competing interests exist.

Figures

Figure 1
Figure 1. Steady state localization of wtPrP and various disease-causing mutants.
(A) Indirect immunofluorescent localization of PrP using the 3F4 antibody in N2a cells transiently transfected with wtPrP or any of 7 different PrP mutants. Identical detector settings were used to image representative fields of cells. (B) Enlarged images of single cells chosen from the corresponding fields from panel A illustrate the overall subtle differences in localization of C-terminal mutant PrPs compared to wtPrP and PrP(A117V). (C) Cells co-expressing fluorescently tagged wtPrP and PrP(H187R) were imaged. Pseudocolored depiction of the mutant∶wt fluorescence ratio in different cellular locales is shown in the last panel (scale is below the image).
Figure 2
Figure 2. Single-cell quantitative analysis of PrP localization.
(A) Cells expressing wtPrP (blue) or PrP(H187R) (red) were immunofluorescently labeled and quantified on a cell-by-cell basis (as detailed in Fig. S2) to determine the percent of total fluorescence found in intracellular compartments. This value (% intracellular) is plotted against expression level, with each point representing an individual cell. Data collected from a single representative experiment is shown. Vertical dashed lines demarcate the boundaries of low, medium and high PrP expression levels that were used to bin cells for statistical analysis. The mean intracellular PrP levels (%) for each of these expression levels is listed for both wtPrP and PrP(H187R). Asterisks indicate statistical significance from wtPrP for points falling within the respective expression levels (p<10−4, p<10−7, and p<10−16 at low, medium, and high expression levels, respectively). (B) Analysis performed as in panel A, but for PrP(E200K). (C) Analysis of PrP(A117V) as in panel A. Note that the entire experiment (panels A–C) was performed at the same time, and that the wtPrP data points are included in each graph for comparison.
Figure 3
Figure 3. All globular domain PrP mutants display altered localization.
Cells expressing wtPrP and the indicated mutants were stained, imaged and analyzed as in Fig. 2. The surface∶intracellular ratio of PrP is plotted for each of the mutants for comparison with wtPrP. Data points represent individual cells from a single representative experiment. All mutants were analyzed together on the same day. Horizontal black bars indicate the mean values for each data set. Each mutant dataset was compared to wtPrP by the Student's t-test and found to be statistically significant in all cases (p<10−8), except PrP(A117V).
Figure 4
Figure 4. Biochemical identification of a mutant-specific subpopulation of misfolded PrP.
(A) Detergent lysates from cells expressing wtPrP or PrP(H187R) were separated into soluble (S) and insoluble (P) fractions, resolved by SDS-PAGE and immunoblotted using the 3F4 antibody. The cells were either analyzed directly (untreated) or first digested with 100 µg/ml of extracellular trypsin to remove cell surface proteins prior to lysis. The migration of different PrP species are indicated on the left: Mat = mature PrP with the full complement of complex glycans; Imm = immature PrP with core glycans; −CHO = unglycosylated PrP. (B) Cells expressing PrP(H187R) were either left untreated (U), digested with 100 µg/ml of extracellular trypsin (T), or digested with trypsin in the presence of 0.2% Triton X-100 detergent (T/D) before harvesting for SDS-PAGE and immunoblotting. (C) Detergent lysates from cells expressing wtPrP or PrP(H187R) were digested with EndoH (E) or with PNGase (P) or left untreated (−), prior to analysis by SDS-PAGE and immunoblotting for PrP. The lower panel shows this blot stripped and re-probed with an antibody against an ER resident glycoprotein, TRAPα. (D) Cells expressing wtPrP or each of 10 PrP mutants were digested with extracellular trypsin, harvested in detergent, separated into soluble (S) and insoluble (P) fractions, and analyzed by immunoblotting. For comparison, one-fourth the amount of total untreated (U) cell lysate is shown. (E) Analysis of the indicated PrP mutants by glycosidase digestions as in panel C.
Figure 5
Figure 5. Analysis of PrP mutants in HeLa cells.
(A) Wild type PrP, PrP(H187R) and PrP(E200K) were expressed in HeLa cells and analyzed for detergent solubility and surface trypsin digestion as in Figure 4. Mock-transfected cells were also analyzed in parallel. Very long exposures of the blot revealed low level endogenous PrP expression in the mock transfected sample, but insufficient to interfere with analysis of the transfected PrP. (B) Analysis of the detergent-insoluble fraction of either WT or mutant PrPs for glycosidase digestions. TRAPα in the detergent soluble fraction is shown as a control for the digestions.
Figure 6
Figure 6. Limited protease digestion analysis for folding status of PrP mutants.
Total detergent lysates of the indicated PrP constructs were digested with various concentrations of trypsin on ice before separation into soluble and insoluble fractions that were analyzed by immunoblots. Note that these digestion conditions are significantly milder than that used for analysis of surface exposure (e.g., in Fig. 4A and 5A), where trypsin fully digests the PrP mutants.
Figure 7
Figure 7. Immature mutant PrP species persist in post-ER intracellular compartments.
(A) Pulse-chase analysis of cells expressing wtPrP and PrP(H187R). Cells were pulsed for 10 minutes with 35S-methionine, chased for the times indicated (in hours) and total cell lysates were immunoprecipitated for PrP. The asterisk (*) indicates lanes whose desitometric profile is shown below. (B) Cells expressing wtPrP or PrP(H187R) were analyzed by pulse-chase analysis as described in panel A. Just prior to harvesting the cells, they were either treated with 100 µg/ml of extracellular trypsin (+Trypsin) or were left untreated. The asterisk (*) indicates lanes whose densitometric profile is shown below. (C) Pulse (0 hours) and chase (0.5 hours) samples from PrP(H187R) expressing cells were digested with EndoH (E), PNGase (P) or left untreated (−). Note that essentially all of the PrP is converted from EndoH sensitive (at pulse) to resistant forms (at chase), including the immature forms (indicated by asterisk).
Figure 8
Figure 8. PrP mutants pass ER quality control and are not degraded by proteasomes.
(A) Pulse-chase samples from wtPrP and PrP(H187R) expressing cells were separated into detergent soluble (S) and insoluble (P) fractions, immunoprecipitated, and analyzed by autoradiography. (B) Pulse-chase analysis of wtPrP or PrP(H187R) expressing cells as in panel A, but in the presence of 10 µg/ml of Brefeldin A, an inhibitor of ER to Golgi trafficking. (C) Pulse-chase analyses of wtPrP and PrP(H187R) in the absence or presence of 5 µM MG132, a proteasomal inhibitor. (D) A4 cells expressing wtPrP or PrP(H187R) were separated into detergent soluble (S) and insoluble (P) fractions and analyzed by immunoblotting for PrP.
Figure 9
Figure 9. PrP mutants are metabolized in acidic intracellular compartments.
(A) N2a cells expressing wtPrP or PrP(H187R) were treated with 0.1 µg/ml of Bafilomycin A1 or vehicle for 6 hours before analyzing total cell lysates by immunoblotting. (B) Pulse-chase analysis of cells expressing wtPrP or PrP(H187R) in the absence (−) or presence (+) of 0.1 µg/ml of Bafilomycin A1. Indicated chase samples were further fractionated into detergent soluble (S) and insoluble (P) components. (C) Cells expressing wtPrP or PrP(H187R) were treated with Bafilomycin A1 or vehicle for 12 hours before analyzing total cell lysates, the conditioned media, and exosomes by immunoblotting. Six-fold relative amount of the media and exosome samples were analyzed. Two exposures of the blot are shown.
Figure 10
Figure 10. The N-terminus of PrP modulates mutant PrP metabolism.
(A) The full length (FL) or N-terminally deleted (ΔN, lacking residues 23–48) constructs for wild type and mutant PrPs were analyzed by the detergent solubility assay. In each case, deletion of the N-terminus resulted in decreased insoluble forms. A corresponding increase in the fully mature soluble form is apparent in most cases. (B) Pulse chase analyses (as in Fig. 7A) of wtPrP, PrP(H187R), wtPrPΔN and PrP(H187R)ΔN were quantified by phosphorimaging. The left panel plots the appearance of fully mature species (as a proportion of total PrP) over time. The middle panel shows the time course of disappearance for immature glycosylated species (plotted as a percent of the amount present at pulse). The inclusion of 5 µM MG132, a proteasome inhibitor, had no effect on the immature species for PrP(H187R)ΔN. The right panel shows the fate of unglycosylated PrP, without or with 5 µM MG132. (C) Lysates harvested after pulse labeling with S35-methionine from cells expressing wtPrP, wtPrPΔN, PrP(H187R) and PrP(H187R)ΔN were separated into detergent soluble (S) and insoluble (P) fractions, immunoprecipitated, and analyzed by autoradiography. The percent of labeled PrP that is insoluble is indicated below the respective panels.
Figure 11
Figure 11. Conserved Lysines in the N-terminus modulate the fate of PrP mutants.
(A) Single-cell quantification of localization as in Fig. 2 was performed on cells expressing wtPrP (blue) , PrP(H187R) (red) and PrP(H187R)-KR3 (green), construct in which three conserved Lysines in the N-terminus were changed to Arginines. PrP(H187R) was statistically different from wtPrP (*, p = .003), and PrP(H187R)-KR3 was statistically different from PrP(H187R) (**, p = .0006). (B) Pulse-chase analysis of cells expressing PrP(H187R) and PrP(H187R)-KR3, performed as in Fig. 7A. The asterisks indicate lanes whose desitometric profile is shown below. (C) Cells expressing the indicated constructs either lacking or containing the KR3 mutation in the N-terminus were analyzed by the detergent solubility assays as in Fig. 10A. The percent of each construct in the detergent-insoluble pellet was quantified and plotted.

Similar articles

Cited by

References

    1. Gregersen N, Bross P, Vang S, Christensen JH. Protein misfolding and human disease. Annu Rev Genomics Hum Genet. 2006;7:103–124. - PubMed
    1. Morimoto RI. Proteotoxic stress and inducible chaperone networks in neurodegenerative disease and aging. Genes Dev. 2008;22:1427–1438. - PMC - PubMed
    1. Anelli T, Sitia R. Protein quality control in the early secretory pathway. EMBO J. 2008;27:315–327. - PMC - PubMed
    1. Arvan P, Zhao X, Ramos-Castaneda J, Chang A. Secretory pathway quality control operating in Golgi, plasmalemmal, and endosomal systems. Traffic. 2002;3:771–780. - PubMed
    1. Aguzzi A, Baumann F, Bremer J. The prion's elusive reason for being. Ann Rev Neurosci. 2008;31:439–477. - PubMed

Publication types

MeSH terms