. 2009 Jun;5(6):e1000417.
doi: 10.1371/journal.pcbi.1000417. Epub 2009 Jun 19.

Global prediction of tissue-specific gene expression and context-dependent gene networks in Caenorhabditis elegans

Affiliations

Global prediction of tissue-specific gene expression and context-dependent gene networks in Caenorhabditis elegans

Maria D Chikina et al. PLoS Comput Biol. 2009 Jun.

Abstract

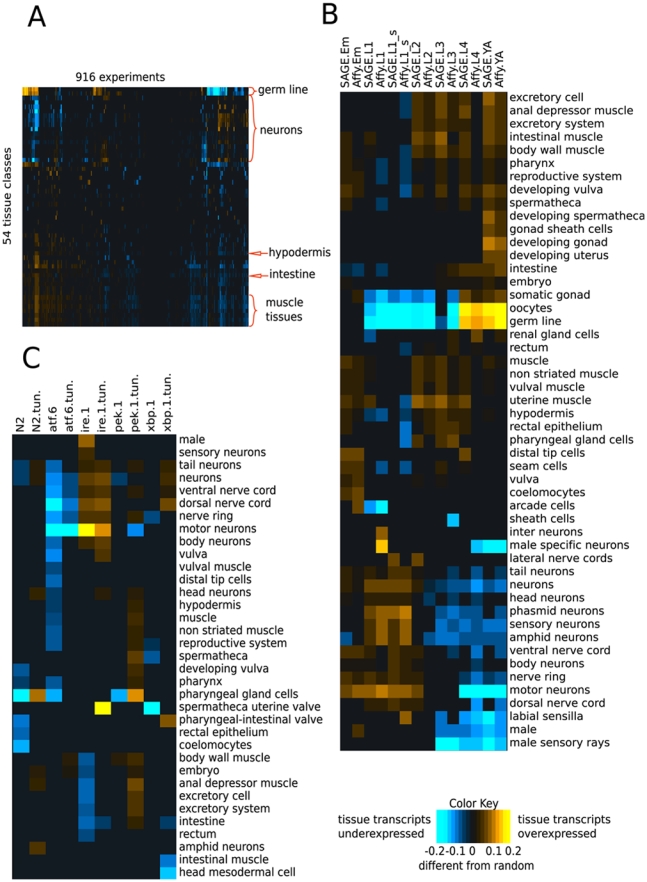
Tissue-specific gene expression plays a fundamental role in metazoan biology and is an important aspect of many complex diseases. Nevertheless, an organism-wide map of tissue-specific expression remains elusive due to difficulty in obtaining these data experimentally. Here, we leveraged existing whole-animal Caenorhabditis elegans microarray data representing diverse conditions and developmental stages to generate accurate predictions of tissue-specific gene expression and experimentally validated these predictions. These patterns of tissue-specific expression are more accurate than existing high-throughput experimental studies for nearly all tissues; they also complement existing experiments by addressing tissue-specific expression present at particular developmental stages and in small tissues. We used these predictions to address several experimentally challenging questions, including the identification of tissue-specific transcriptional motifs and the discovery of potential miRNA regulation specific to particular tissues. We also investigate the role of tissue context in gene function through tissue-specific functional interaction networks. To our knowledge, this is the first study producing high-accuracy predictions of tissue-specific expression and interactions for a metazoan organism based on whole-animal data.


Conflict of interest statement

The authors have declared that no competing interests exist.

Figures

Figure 1
Figure 1. Over- or under-expression of tissue-specific transcripts is quantified using a rank-sum statistic corrected to 0.05 false discovery rate.
Tissues with no significant results are omitted. (A) A global view of all microarray experiments (clustered on both axes). Significant tissue biases can be observed across the compendium, with neuronal and germ line signals being especially prevalent. Yellow square for a specific tissue and condition combination indicates that genes known (in our gold standard, see Methods) to be expressed in that tissue are over-expressed -(as compared to background) in that microarray condition. (B, C) Detailed views of parts of the matrix in (A). (B) Levels of over- or under-expression of tissue-specific transcripts in developmental time course experiments on SAGE and Affymetrix platforms (clustered on both axes). Over- and under-expression of tissue-specific genes coincides with the timing of tissue development. (C) Levels of over- or under-expression of tissue-specific transcripts in the unfolded protein response study Shen et al. (clustered on the y axis). Mutations in the UPR pathway genes invoke tissue-specific responses. Treatment with tunicamycin is denoted as (tun.).
Figure 2
Figure 2. Classifier performance.
(A) Accuracy of predictions for major tissues. These precision-recall plots demonstrate the trade-off between the number of genes predicted and the fraction of the predictions that is correct. Red lines show the performance of our approach using all available microarray data, while green lines show performance using only whole-animal studies. High precision can be achieved by using whole-animal experiments alone. The accuracy and coverage of existing high-throughput studies is shown with triangles and circles. The use of datasets addressing tissue-specific expression improves accuracy in some but not all cases. (B) Precision at 10% recall for small tissues compared with expected precision based on the genomic background. We compare the fraction of true positives in the top 10% of our predictions against the fractions that would be expected if the genes were chosen randomly (genome background).
Figure 3
Figure 3. Expression of GFP-reporter constructs.
(A) K08B12.1 was predicted to express in hypodermis; the reporter construct expressed exclusively in hypodermis. Expression was variable, strongest in embryo-L1, though detectable in all stages. (B) F58H1.2 was predicted to express in hypodermis; the reporter construct expressed exclusively in hypodermis. Expression was variable, strongest in embryo-L1 and not detectable in adults. (C) F55H12.4 was predicted to express in the hypodermis. pF55H12.4::GFP expressed in hypodermis, vulva, anus, and to a lesser extent pharynx. Hypodermal expression was highly variable and was strongest in L4 and Adult stages. (D) C29F5.1 was predicted to express in muscle. The reporter construct was observed in body wall, vulval, and anal but not pharyngeal muscle in all stages. (E) F13D12.6 was predicted to express in the intestine and the reporter construct expressed exclusively in intestinal cells at all stages. (F) gnrr-1 was predicted to express in neurons. Strong expression of pgnrr-1::GFP was seen in various head neurons at all stages. Expression was also observed in the anterior pharynx and ventral nerve cord neurons. (A,B) Seam cell exclusion is observed in these lines, which is typical of hypodermally expressed genes; see Gilleard et al. for examples of hypodermal expression.
Figure 4
Figure 4. Motifs over-represented in the promoters of top predictions.
(*) indicates motifs that have not been previously reported to be enriched in promoters of tissue-specific genes in C. elegans.
Figure 5
Figure 5. Tissue bias in microRNA target predictions.
Our tissue-specific expression predictions allow us to systematically evaluate which C. elegans microRNA genes have a tissue bias in their predicted targets and thus are candidates for regulating tissue specific processes. For each microRNA gene we evaluate list of potential targets (as generated by three target prediction algorithms) against our tissue expression prediction scores using a rank test. (Average AUC is plotted, (*) indicates the interaction was significant (p<0.01) based on two out of three target sets, (**) was significant in all three. For each microRNA-tissue pair, enrichment (red) signifies that the targets of that microRNA are predicted to express in that tissue with scores that are significantly higher than would be expected if no bias is present. Avoidance (green) signifies that the microRNA targets have expression prediction scores that are significantly lower than expected. Since microRNAs down-regulate the levels of their targets, avoidance in one tissue coupled with preference in several others may imply involvement in differentiation, whereby the microRNA downregulates alternative tissue expression profiles.
Figure 6
Figure 6. Tissue-specific weighted correlation networks allow elucidation of tissue-specific gene function.
Top 20 predicted interactions partners and strongest inter-partner interactions are shown. Genes are colored according to known tissue-specific function: yellow indicates neuronal function, and red indicates involvement in a germ-line/oocyte process. (A) Neuron-specific network around exc-7. An extended SVM algorithm was used to predict tissue-specific functional interactions. Although exc-7 is best characterized as playing a role in the formation of the excretory cell, it has also been shown to regulate cholinergic synaptic transmission. Many of its functional interaction partners are consistent with this neuron-specific function. (B)Tissue-specific networks for let-60. let-60 is the homolog of mammalian Ras protein that is involved, among other processes, in chemosensation and progression through meiosis during oogenesis. The functional interaction partners identified for let-60 are completely different in the neuron and germ line networks, reflecting that this gene plays a different functional role in the context of different tissues.

References

    1. Fowlkes CC, Hendriks CL, Keranen SV, Weber GH, Rubel O, et al. A quantitative spatiotemporal atlas of gene expression in the Drosophila blastoderm. Cell. 2008;133:364–374. - PubMed
    1. Tomancak P, Berman BP, Beaton A, Weiszmann R, Kwan E, et al. Global analysis of patterns of gene expression during Drosophila embryogenesis. Genome Biol. 2007;8:R145. - PMC - PubMed
    1. Su AI, Wiltshire T, Batalov S, Lapp H, Ching KA, et al. A gene atlas of the mouse and human protein-encoding transcriptomes. Proc Natl Acad Sci U S A. 2004;101:6062–6067. - PMC - PubMed
    1. Lein ES, Hawrylycz MJ, Ao N, Ayres M, Bensinger A, et al. Genome-wide atlas of gene expression in the adult mouse brain. Nature. 2007;445:168–176. - PubMed
    1. Bamps S, Hope IA. Large-scale gene expression pattern analysis, in situ, in Caenorhabditis elegans. Brief Funct Genomic Proteomic. 2008;7:175–183. - PubMed

Publication types

MeSH terms