

Natural triterpenic diols promote apoptosis in astrocytoma cells through ROS-mediated mitochondrial depolarization and JNK activation
- PMID: 19543395
- PMCID: PMC2695006
- DOI: 10.1371/journal.pone.0005975
Natural triterpenic diols promote apoptosis in astrocytoma cells through ROS-mediated mitochondrial depolarization and JNK activation
Abstract
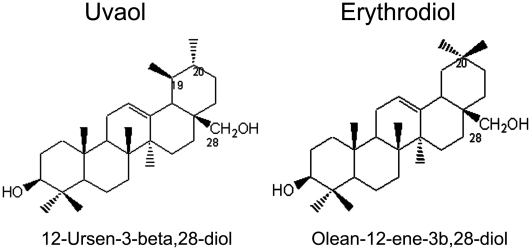
Background: Triterpene alcohols and acids are multifunctional compounds widely distributed throughout the plant kingdom that exhibit a variety of beneficial health properties, being synthetic analogs of oleanolic acid under clinical evaluation as anti-tumoral therapeutic agents. However, the antineoplastic activity of two natural occurring triterpenoid alcohols extracted from olive oil, erythrodiol (an intermediate from oleanolic acid), and its isomer, uvaol, has barely been reported, particularly on brain cancer cells. Astrocytomas are among the most common and aggressive type of primary malignant tumors in the neurological system lacking effective treatments, and in this study, we addressed the effect of these two triterpenic diols on the human 1321N1 astrocytoma cell line.
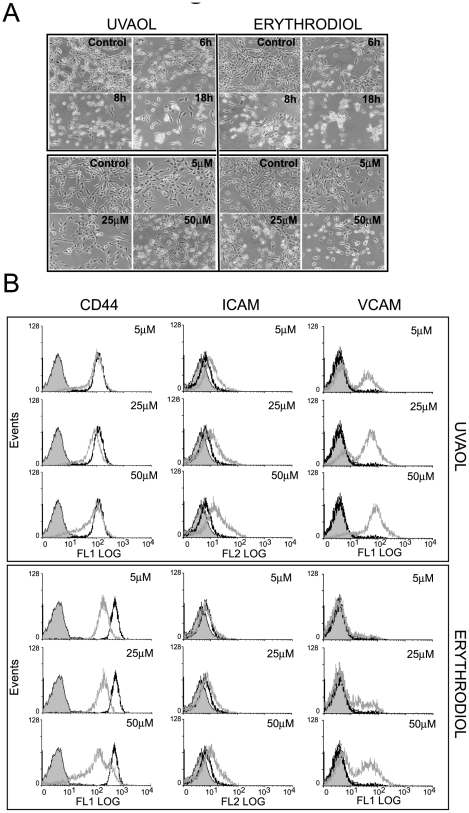
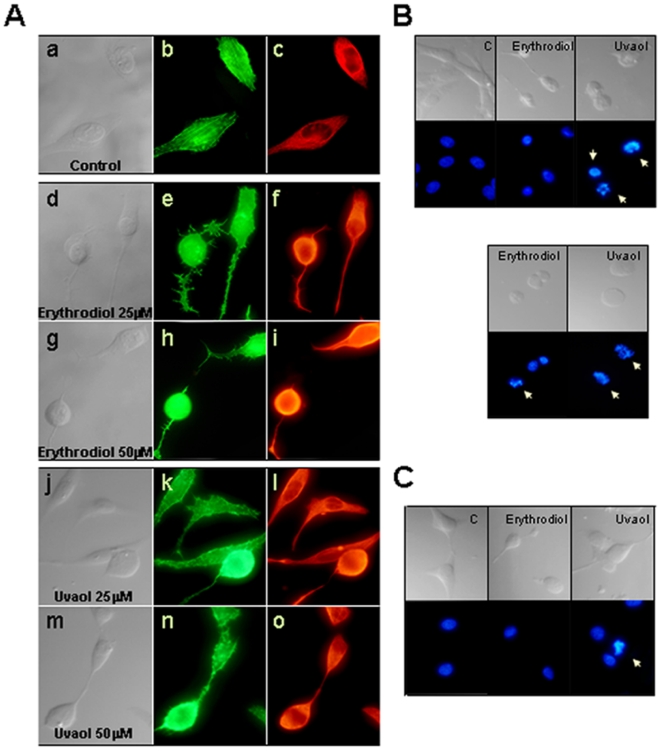
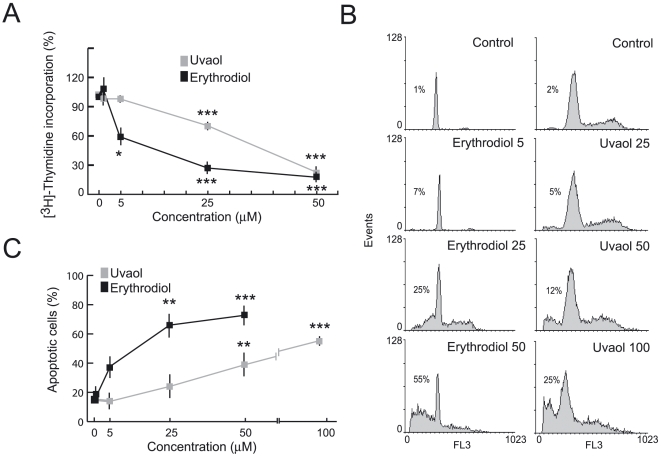
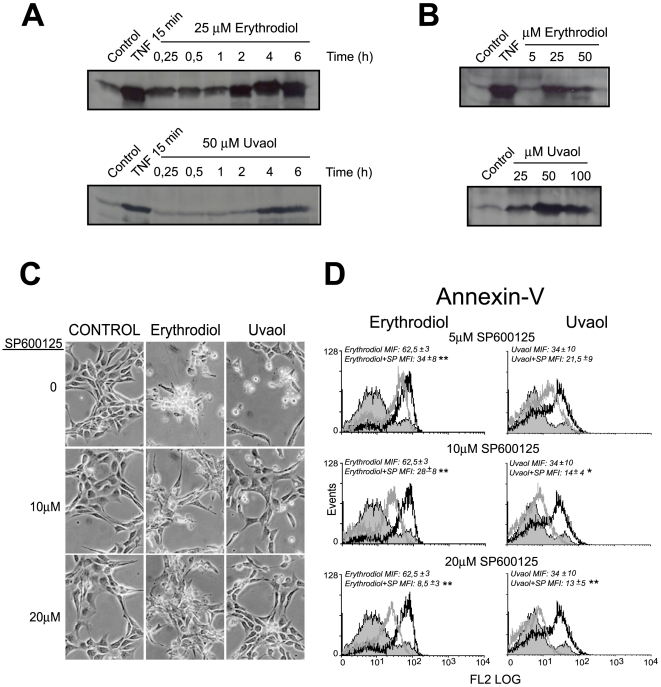
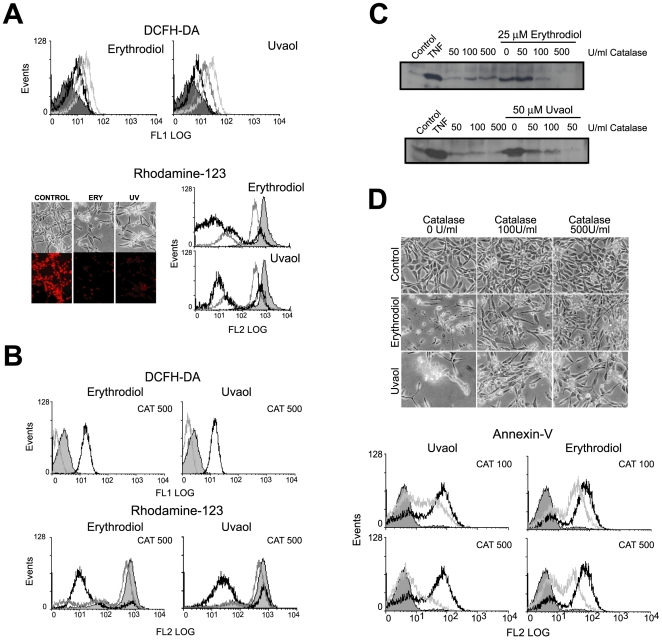
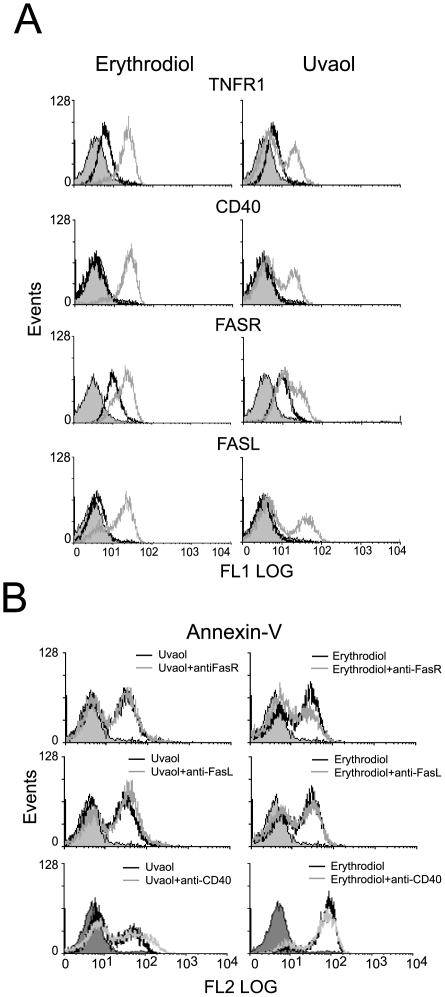
Principal findings: Erythrodiol and uvaol effectively affected cell proliferation, as well as cell cycle phases and induced 1321N1 cell death. Both triterpenes successfully modulated the apoptotic response, promoting nuclear condensation and fragmentation. They caused retraction and rounding of cultured cells, which lost adherence from their supports, while F-actin and vimentin filaments disappeared as an organized cytoplasmic network. At molecular level, changes in the expression of surface proteins associated with adhesion or death processes were also observed. Moreover, triterpene exposure resulted in the production of reactive oxygen species (ROS) with loss of mitochondrial transmembrane potential, and correlated with the activation of c-Jun N-terminal kinases (JNK). The presence of catalase reversed the triterpenic diols-induced mitochondrial depolarization, JNK activation, and apoptotic death, indicating the critical role of ROS in the action of these compounds.
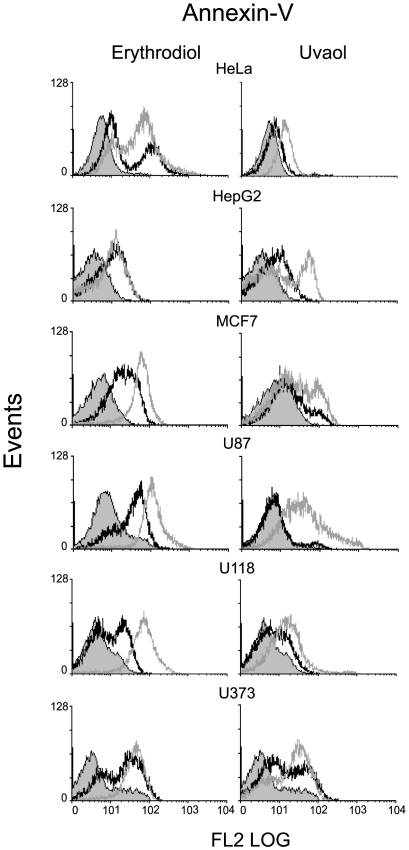
Conclusions: Overall, we provide a significant insight into the anticarcinogenic action of erythrodiol and uvaol that may have a potential in prevention and treatment of brain tumors and other cancers.
Conflict of interest statement
Figures
Similar articles
-
Acidic triterpenes compromise growth and survival of astrocytoma cell lines by regulating reactive oxygen species accumulation.Cancer Res. 2007 Apr 15;67(8):3741-51. doi: 10.1158/0008-5472.CAN-06-4759. Cancer Res. 2007. PMID: 17440087
-
Dual targeting of the mitochondrial Lon peptidase 1 and the chymotrypsin-like proteasome activity as a potential therapeutic strategy in malignant astrocytoma models.Pharmacol Res. 2025 May;215:107697. doi: 10.1016/j.phrs.2025.107697. Epub 2025 Mar 13. Pharmacol Res. 2025. PMID: 40088962
-
The differential localization of a methyl group confers a different anti-breast cancer activity to two triterpenes present in olives.Food Funct. 2015 Jan;6(1):249-56. doi: 10.1039/c4fo00675e. Epub 2014 Nov 20. Food Funct. 2015. PMID: 25412049
-
Erythrodiol, a natural triterpenoid from olives, has antiproliferative and apoptotic activity in HT-29 human adenocarcinoma cells.Mol Nutr Food Res. 2008 May;52(5):595-9. doi: 10.1002/mnfr.200700300. Mol Nutr Food Res. 2008. PMID: 18384095
-
Triterpene acids from Rosa roxburghii Tratt fruits exert anti-hepatocellular carcinoma activity via ROS/JNK signaling pathway-mediated cell cycle arrest and mitochondrial apoptosis.Phytomedicine. 2023 Oct;119:154960. doi: 10.1016/j.phymed.2023.154960. Epub 2023 Jul 8. Phytomedicine. 2023. PMID: 37531905
Cited by
-
Aqueous fraction of Nephelium ramboutan-ake rind induces mitochondrial-mediated apoptosis in HT-29 human colorectal adenocarcinoma cells.Molecules. 2012 May 31;17(6):6633-57. doi: 10.3390/molecules17066633. Molecules. 2012. PMID: 22728359 Free PMC article.
-
Anticoccidial activity of the secondary metabolites in alpine plants frequently ingested by wild Japanese rock ptarmigans.Int J Parasitol Parasites Wildl. 2024 Jul 14;25:100967. doi: 10.1016/j.ijppaw.2024.100967. eCollection 2024 Dec. Int J Parasitol Parasites Wildl. 2024. PMID: 39220322 Free PMC article.
-
Effects of Erythrodiol on the Antioxidant Response and Proteome of HepG2 Cells.Antioxidants (Basel). 2021 Dec 29;11(1):73. doi: 10.3390/antiox11010073. Antioxidants (Basel). 2021. PMID: 35052578 Free PMC article.
-
Uvaol Improves the Functioning of Fibroblasts and Endothelial Cells and Accelerates the Healing of Cutaneous Wounds in Mice.Molecules. 2020 Oct 28;25(21):4982. doi: 10.3390/molecules25214982. Molecules. 2020. PMID: 33126422 Free PMC article.
-
Triterpenes in cancer: significance and their influence.Mol Biol Rep. 2016 Sep;43(9):881-96. doi: 10.1007/s11033-016-4032-9. Epub 2016 Jun 25. Mol Biol Rep. 2016. PMID: 27344437 Review.
References
-
- Russell D, Rubinstein L. Pathology of tumors of the nervous system, 5th ed. Baltimore: Williams and Wilkins; 1989. pp. 219–47.
-
- Doolittle ND, Abrey LE, Bleyer WA, Brem S, Davis TP, et al. New frontiers in translational research in neuro-oncology and the blood-brain barrier: report of the tenth annual Blood-Brain Barrier Disruption Consortium Meeting. Clin Cancer Res. 2005;11:421–428. - PubMed
-
- Herr LI, Debatin KM. Cellular stress response and apoptosis in cancer therapy. Blood. 2001;98:2603–2614. - PubMed
-
- Ficher DE. Apoptosis in cancer therapy crossing the threshold. Cell. 1994;78:539–542. - PubMed
-
- Thornberry NA, Lazebnik Y. Caspases: enemies within. Science. 1998;281:1312–1316. - PubMed
Publication types
MeSH terms
Substances
LinkOut - more resources
Full Text Sources
Other Literature Sources
Medical
Research Materials
Miscellaneous
