. 2010 Jan-Feb;12(1):63-70.
doi: 10.1007/s11307-009-0235-y. Epub 2009 Jun 19.

Intravital imaging of tumor apoptosis with FRET probes during tumor therapy

Affiliations

Intravital imaging of tumor apoptosis with FRET probes during tumor therapy

Feifan Zhou et al. Mol Imaging Biol. 2010 Jan-Feb.

Abstract

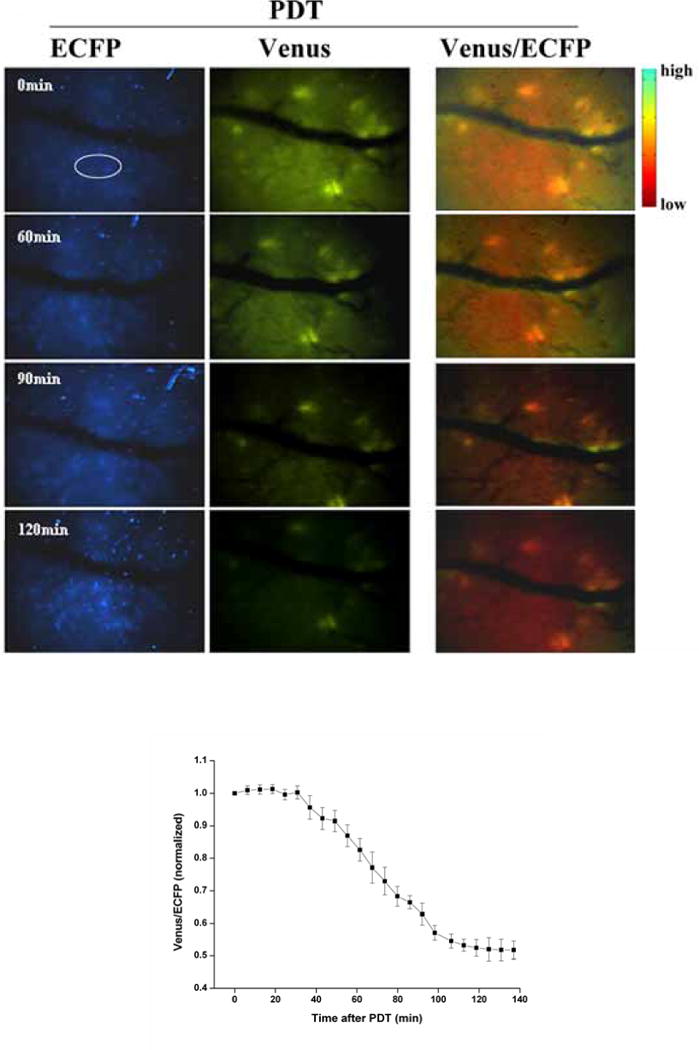
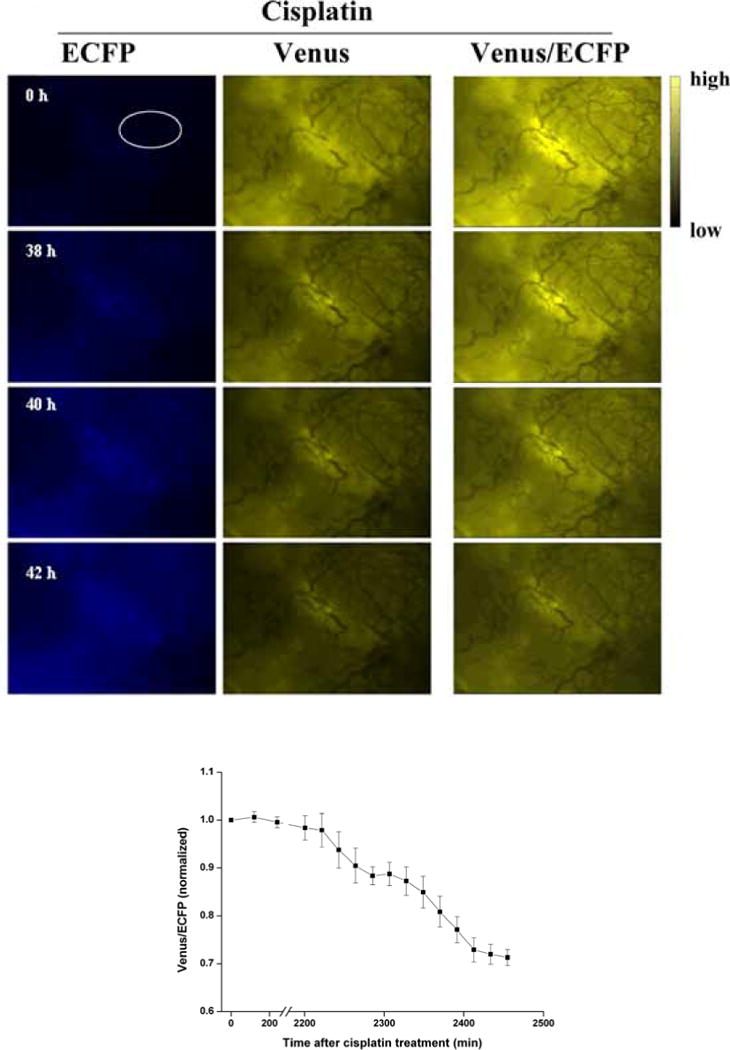
Purpose: The aim of the study is to dynamically and non-invasively monitor the apoptosis events in vivo during photodynamic therapy (PDT) and chemotherapy.

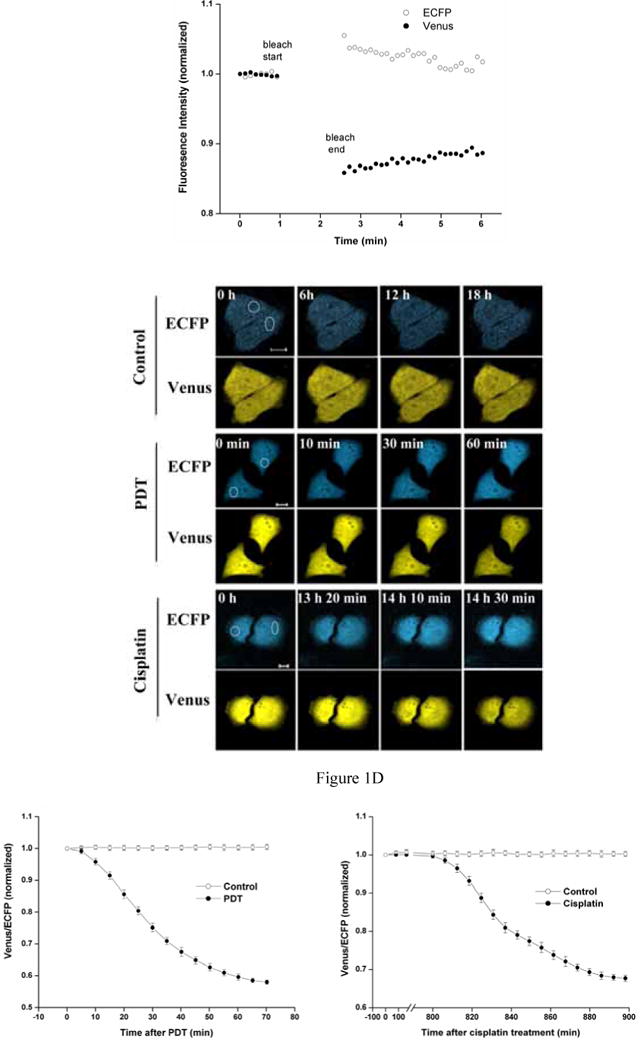
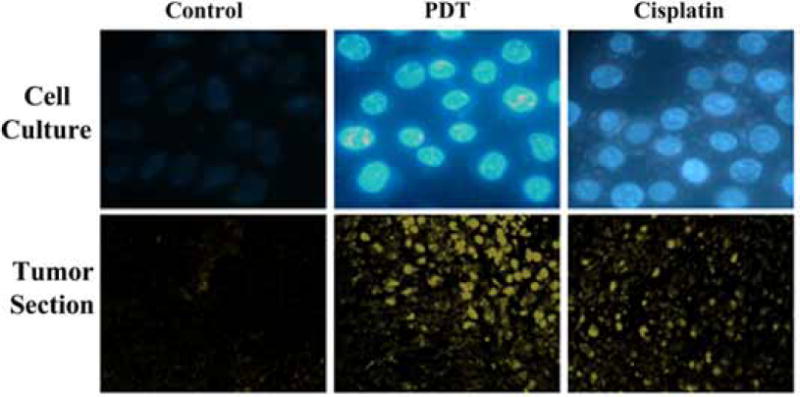
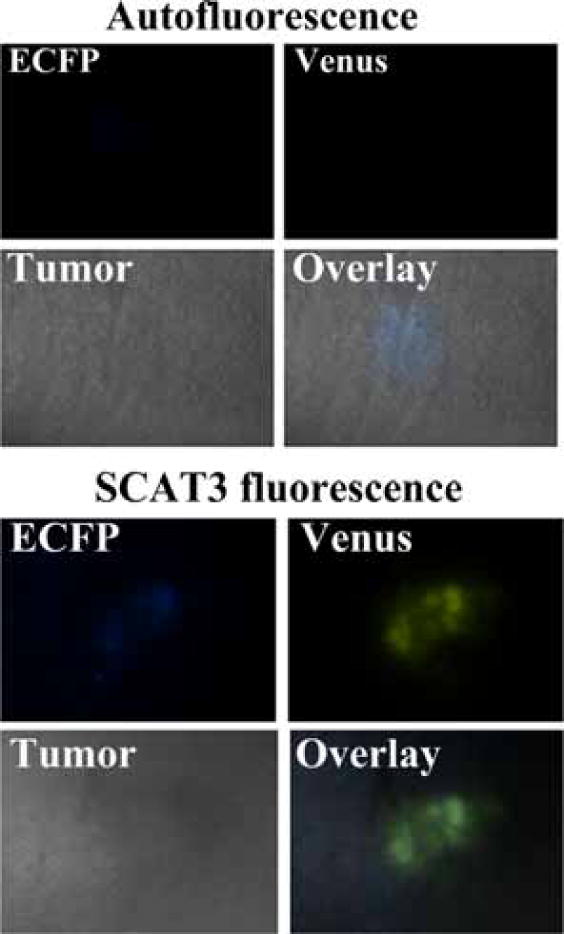
Procedures: A FRET probe, SCAT3, was utilized to determine activation of caspase-3 during tumor cell apoptosis in mice, induced by PDT, and cisplatin treatments. Using this method, dynamics of caspase-3 activation was observed both in vitro and in vivo.

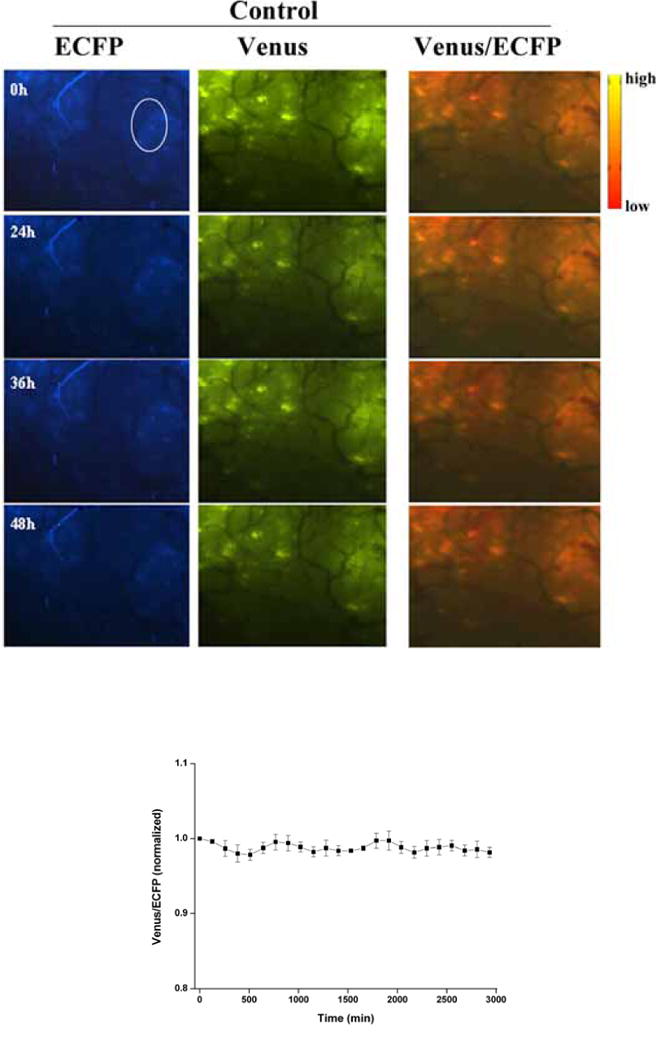
Results: Analysis of the fluorescent missions from tumor cells indicated that the caspase-3 activation started immediately after PDT treatment. In contrast, the caspase-3 activation started about 13 and 36 h after cisplatin treatment in vitro and in vivo, respectively.

Conclusions: FRET could be used effectively to monitor activation of caspase-3 in living organism. This method could be used to provide rapid assessment of apoptosis induced by anti-tumor therapies for improvement of treatment efficacy.


Figures

Figure 1
Figure 1
A. Quantitative analysis of ECFP and Venus fluorescence following repeated scanning. FRET decreases significantly due to bleaching of Venus. Venus was bleached using the Ar 514 nm line. B. Fluorescent images of ECFP and Venus of ASTC-a-1 cells after PDT or cisplatin treatment. For controls, the SCAT3-expressing ASTC-a-1 cells were exposed to room air and kept at 37°C for 18 hours. For PDT treatment, the SCAT3-expressing ASTC-a-1 cells were exposed to 3 μg/ml Photofrin for 20 hours in the dark, and then treated with 633 nm light (5 J/cm2). For chemotherapy, cisplatin in aqueous solution was mixed with cells (1×10⁵) growing in 35 mm Petri dishes with a final cisplatin concentration of 20 μM. After treatment, cells were observed using a confocal microscope. Bar=10 μm. C and D. Time course of Venus/ECFP fluorescence intensity ratio obtained from four regions of interest (ROIs) of the cells in tissue culture after PDT treatment (C) and cisplatin treatment (D), mean±SD, n=4.
Figure 2
Figure 2
Photodynamic therapy and cisplatin treatment induced apoptosis. For cells in culture, Hoechst 33325 staining was performed 3 hours after PDT treatment and 20 hours after cisplatin treatment (upper panel). For tissue sections from mouse tumors, TUNEL staining was performed 6 hours after PDT treatment and 60 hours after cisplatin treatment (lower panel). The fluorescent emissions from tumor cells treated by PDT and cisplatin indicate apoptosis.
Figure 3
Figure 3
Fluorescent emissions of ECFP and Venus from a mouse tumor sample, seven days after inoculation of tumor cells with and without transfection of the SCAT3 probes, observed with a fluorescence stereo microscope. The tumor cells without SCAT3 shows weak fluorescent emission (top panel), while the tumor transfected by SCAT3 shows strong fluorescent emission (bottom panel). These results indicate that the fluorescent emission is indeed from the transfected tumor cells, not from the cell autofluorescence.
Figure 4
Figure 4
The stability of FRET signals in a control mouse tumor, observed by the fluorescence stereo microscope. A. Fluorescent images of ECFP, Venus, and Venus/ECFP from a mouse tumor without treatment at 0, 24, 36 and 48 h, starting on day 7 of inoculation of tumor cells. B. Time course of Venus/ECFP fluorescence intensity ratio obtained from four ROIs of the control mouse tumor. The fluorescent images and intensities of ECFP and Venus emission were acquired with a fluorescence stereo microscope, starting on day 7 after inoculation with tumor cells stably expressing SCAT3.
Figure 5
Figure 5
Dynamics of caspase-3 activation in a mouse tumor after PDT treatment. A. Fluorescent images of ECFP, Venus, and Venus/ECFP from a mouse tumor at 0, 60, 90 and 120 min after PDT treatment. B. Time course of the Venus/ECFP fluorescence intensity ratio obtained from four ROIs of the mouse tumor after PDT treatment. On day 7 after inoculation with tumor cells stably expressing SCAT3, Photofrin was administered i.p. with a dose of 10 mg/kg. The tumor was illuminated with 633 nm light (120 J/cm2 at 40 mW/cm2) 24 hours later. The fluorescent images and intensities of ECFP and Venus emission were acquired by the fluorescence stereo microscope, immediately after the laser irradiation.
Figure 6
Figure 6
Dynamics of caspase-3 activation in a mouse tumor after cisplatin therapy. A. Fluorescent images of ECFP, Venus, and Venus/ECFP from a mouse tumor at 0, 38, 40 and 42 h after cisplatin treatment. B. Time course of the Venus/ECFP fluorescence intensity ratio obtained from four ROIs of the mouse tumor after cisplatin treatment. On day 7 after inoculation with tumor cells stably expressing SCAT3, animals received daily i.p. injections of cisplatin (10 mg/kg in 100 μl) for 5 consecutive days. The fluorescent images and intensities of ECFP and Venus emission were acquired by the fluorescence stereo microscope, immediately after the last cisplatin injection.

Similar articles

Cited by

References

    1. Ashkenazi A, Dixit VM. Death receptors: signaling and modulation. Science. 1998;281:1305–1308. - PubMed
    1. Nagata S. Apoptosis by death factor. Cell. 1997;88:355–365. - PubMed
    1. Chinnaiyan AM, Prasad U, Shankar S, Hamstra DA, Shanaiah M, Chenevert TL, Ross BD, Rehemtulla A. Combined effect of tumor necrosis factorrelated apoptosis-inducing ligand and ionizing radiation in breast cancer therapy. PNAS. 2000;97:1754–1759. - PMC - PubMed
    1. Blankenberg FG, Katsikis PD, Storrs RW, Beaulieu C, Spielman D, Chen JY, Naumovski L, Tait JF. Quantitative analysis of apoptotic cell death using proton nuclear magnetic resonance spectroscopy. Blood. 1997;89:3778–3786. - PubMed
    1. Aboagye EO, Bhujwalla ZM, Shungu DC, Glickson JD. Detection of tumor response to chemotherapy by 1H nuclear magnetic resonance spectroscopy: effect of 5-fluorouracil on lactate levels in radiation-induced fibrosarcoma 1 tumors. Cancer Res. 1998;58:1063–1067. - PubMed

Publication types