. 2009 Jul;197(1):35-47.
doi: 10.1007/s00221-009-1883-5. Epub 2009 Jun 21.

Removal of visual feedback alters muscle activity and reduces force variability during constant isometric contractions

Affiliations

Removal of visual feedback alters muscle activity and reduces force variability during constant isometric contractions

Harsimran S Baweja et al. Exp Brain Res. 2009 Jul.

Abstract

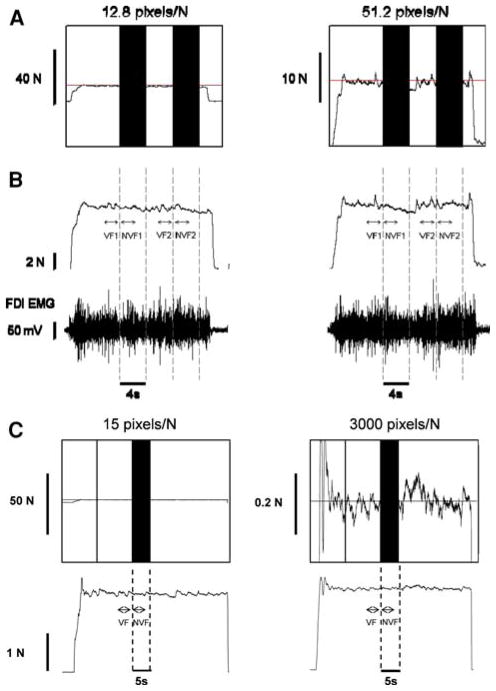
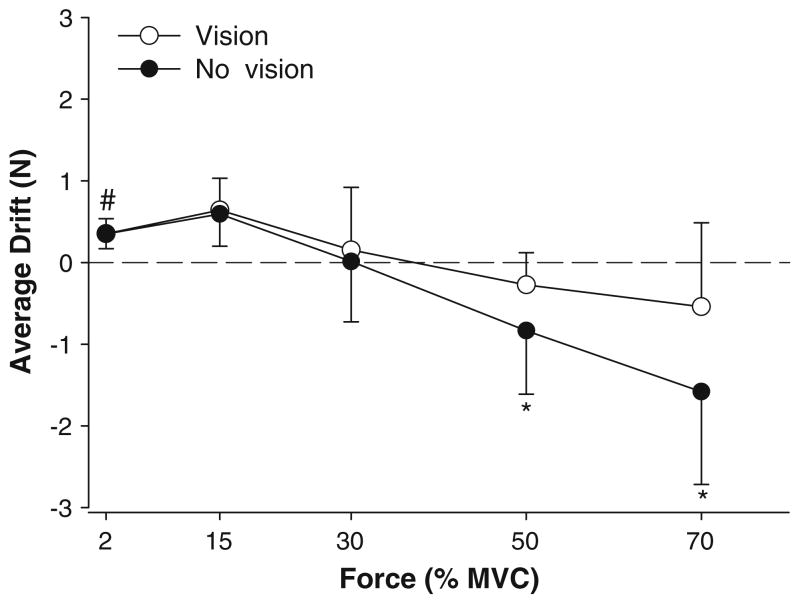
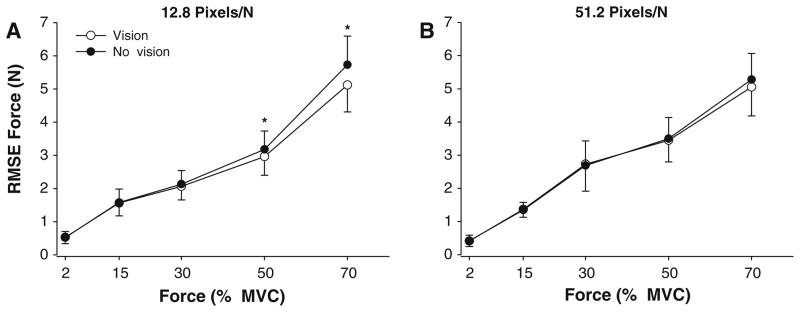
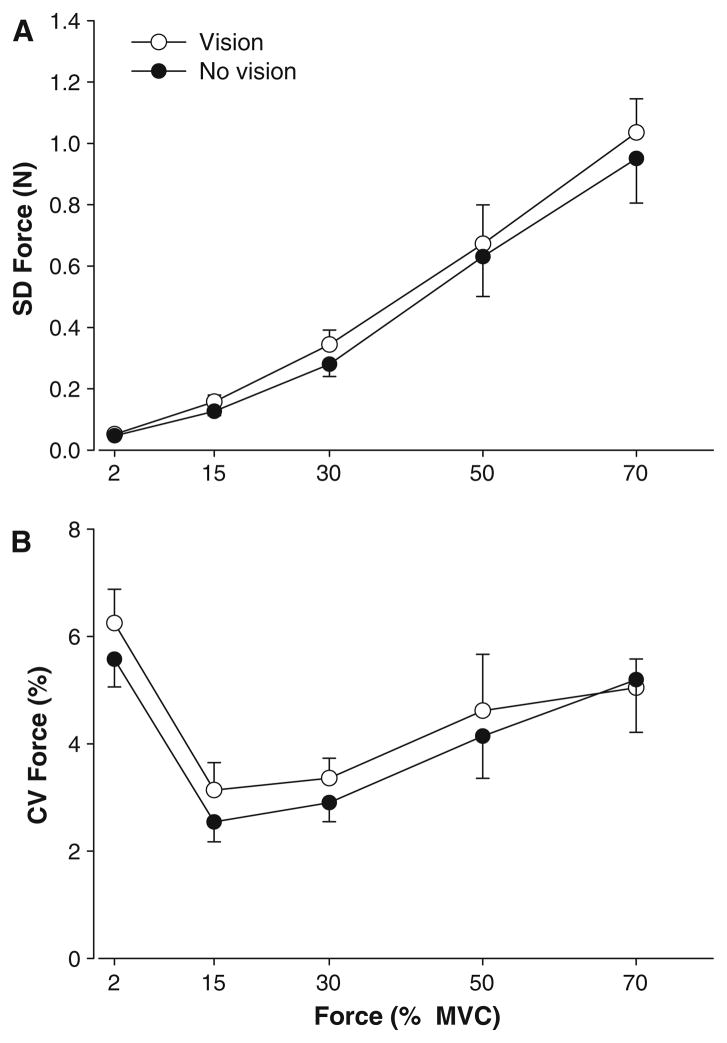
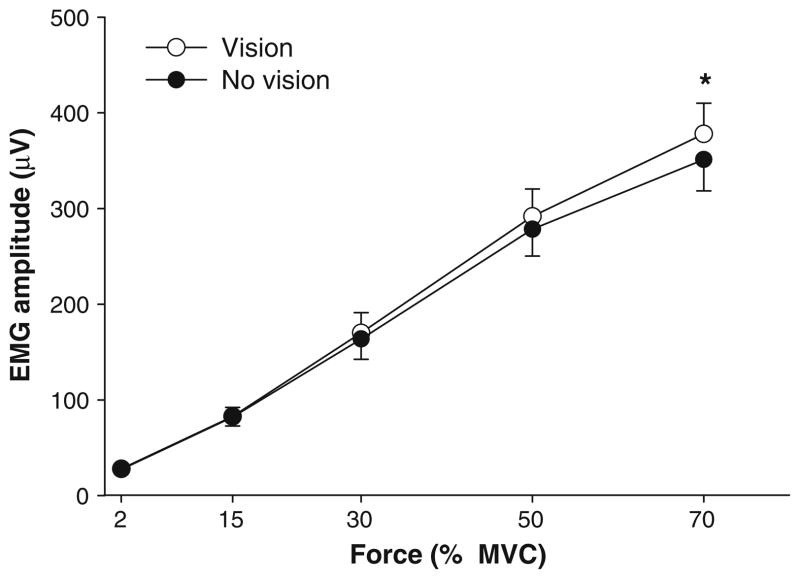
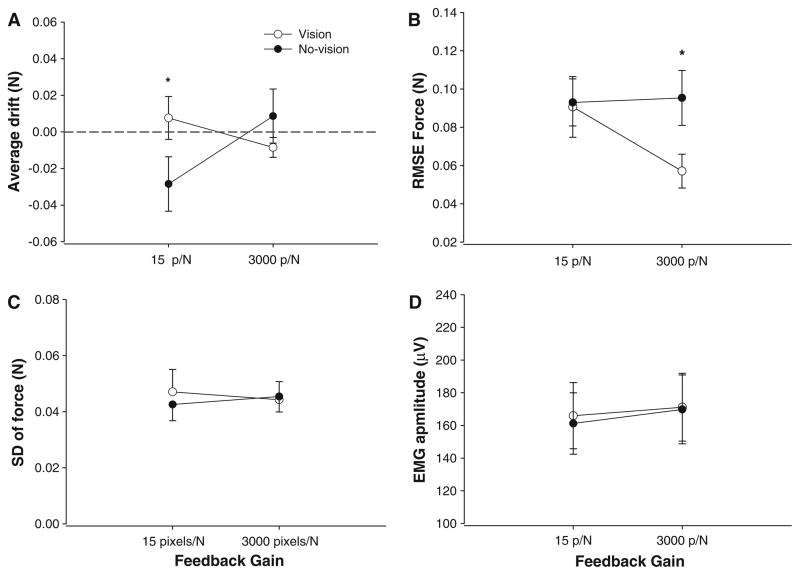
The purpose of this study was to compare force accuracy, force variability and muscle activity during constant isometric contractions at different force levels with and without visual feedback and at different feedback gains. In experiment 1, subjects were instructed to accurately match the target force at 2, 15, 30, 50, and 70% of their maximal isometric force with abduction of the index finger and maintain their force even in the absence of visual feedback. Each trial lasted 22 s and visual feedback was removed from 8-12 to 16-20 s. Each subject performed 6 trials at each target force, half with visual gain of 51.2 pixels/N and the rest with a visual gain of 12.8 pixels/N. Force error was calculated as the root mean square error of the force trace from the target line. Force variability was quantified as the standard deviation and coefficient of variation (CVF) of the force trace. The EMG activity of the agonist (first dorsal interosseus; FDI) was measured with bipolar surface electrodes placed distal to the innervation zone. Independent of visual gain and force level, subjects exhibited lower force error with the visual feedback condition (2.53 +/- 2.95 vs. 2.71 +/- 2.97 N; P < 0.01); whereas, force variability was lower when visual feedback was removed (CVF: 4.06 +/- 3.11 vs. 4.47 +/- 3.14, P < 0.01). The EMG activity of the FDI muscle was higher during the visual feedback condition and this difference increased especially at higher force levels (70%: 370 +/- 149 vs. 350 +/- 143 microV, P < 0.01). Experiment 2 examined whether the findings of experiment 1 were driven by the higher force levels and proximity in the gain of visual feedback. Subjects performed constant isometric contractions with the abduction of the index finger at an absolute force of 2 N, with two distinct feedback gains of 15 and 3,000 pixels/N. In agreement with the findings of experiment 1, subjects exhibited lower force error in the presence of visual feedback especially when the feedback gain was high (0.057 +/- 0.03 vs. 0.095 +/- 0.05 N). However, force variability was not affected by the vastly distinct feedback gains at this force, which supported and extended the findings from experiment 1. Our findings demonstrate that although removal of visual feedback amplifies force error, it can reduce force variability during constant isometric contractions due to an altered activation of the primary agonist muscle most likely at moderate force levels in young adults.


Figures

Fig. 1
Fig. 1
Constant isometric force task with the FDI muscle. a Representative trial from 1 subject when exerting a constant force at 30% MVC with a visual feedback gain of 12.8 pixels/N (left column) and 51.2 pixels/N (right column). Each subject was instructed to exert a force with abduction of the index finger against a force transducer and match the horizontal target line for 22 s. Visual feedback of the target line and exerted force was given to the subjects from 0–8 and 12–16 s (visual feedback condition), whereas visual feedback of the target and exerted force was removed (black bars) from 8–12 and 16–20 s (no visual feedback condition). b The force and EMG analysis was based on selected segments from each trial. The top row represents the force trace for the trials represented in A and the bottom row is the corresponding FDI EMG activity. The analysis was performed from 2.7 to 0.2 s prior to the removal of visual feedback (visual feedback condition; VF1 and VF2) and 0.2–2.7 s after the removal of the visual feedback (no visual feedback condition; NVF1 and NVF2). c Representative trial from 1 subject when exerting a constant force at 2 N with a visual feedback gain of 15 pixels/N (left column) and 3,000 pixels/N (right column). The visual feedback of the target line was given to the subjects from 0 to 25 s (visual feedback condition), whereas visual feedback of the target and the exerted force was removed from 25 to 30 s (no visual feedback condition)
Fig. 2
Fig. 2
Average drift of the force output. The average drift was significantly higher (*) at 50 and 70% MVC in the absence of visual feedback (filled circles) compared with visual feedback (open circles). However, only at 2% MVC the average drift in force was significantly different from the targeted force (#). At 2% MVC force drifted higher than the targeted force and was similar in the presence and absence of visual feedback
Fig. 3
Fig. 3
Force error as a function of visual feedback condition and gain. The RMSE of force increased with the force level for both 12.8 pixels/N (A) and 51.2 pixels/N(B) of visual feedback gain. The RMSE was similar with (open circles) and without (filled circles) visual feedback when the visual feedback gain was 51.2 pixels/N(B). However, the RMSE was significantly greater in the absence of visual feedback at 50 and 70% MVC at 12.8 pixels/N of visual feedback gain (A)
Fig. 4
Fig. 4
Force variability and visual feedback. a The SD of force increased with force level and on average was higher in the presence of visual feedback (open circles). b The CV of force varied significantly across the force levels and similar to the SD of force was higher with visual feedback (open circles) than without visual feedback (filled circles)
Fig. 5
Fig. 5
FDI EMG activity and visual feedback. The FDI EMG activity increased with the force level. Muscle activity was higher with visual feedback (open circles) compared with no visual feedback (filled circles), especially at 70% MVC
Fig. 6
Fig. 6
Power spectrum of the force output. a Representative power spectrum of the force output in the presence (thin line) and absence of visual feedback (thick line) from one subject. The force spectrum was analyzed from 0–1 Hz, 1–3 Hz, 3–7 Hz, and 7–10 Hz (boxes). b Data from all subjects indicated that the structure of force output was similar in the presence (open circles) and absence of visual feedback (filled circles) conditions. On average, ~66% of the power in the force spectrum occurred in the 0–1 Hz bin, ~26% from 1–3 Hz, ~6% from 3 to 7 Hz and ~2% from 7 to 10 Hz
Fig. 7
Fig. 7
The interaction of vision, force, and frequency band of the force output spectrum. The relative power from 0 to 1 Hz increased with force level, whereas the relative power in all other frequency bins decreased with force level. The low-frequency oscillations (a 0–1 Hz and b 1–3 Hz) in force output were significantly greater with visual feedback only at 2 and 15% MVC. In contrast, force oscillations from 1 to 3 Hz (b) at higher force levels (30, 50, and 70% MVC) and oscillations from 3 to 7 Hz (c) from 2 to 30% MVC were significantly higher without visual feedback. Oscillations in the force output from 7 to 10 Hz (d) were similar with and without visual feedback
Fig. 8
Fig. 8
Force output and EMG activity for experiment 2. a The average drift from the targeted force was significantly greater at 15 pixels/N in the absence of visual feedback. b Force accuracy was greater in the presence of visual feedback with high gain visual feedback. c Differences in visual feedback gain did not influence force variability. d Differences in visual feedback gain did not influence the FDI EMG activity

Similar articles

Cited by

References

    1. Baweja HS, Patel BK, Martinkewiz JD, Smith MA, Srinivasan D, Christou EA. Removal of visual feedback alters muscle activity and reduces force variability during constant isometric contractions. Society for Neuroscience; Washington DC: 2008. - PMC - PubMed
    1. Brown P. Cortical drives to human muscle: the Piper and related rhythms. Prog Neurobiol. 2000;60:97–108. - PubMed
    1. Carlton LG. Visual processing time and the control of movement. In: Proteau L, Elliott D, editors. Vision and motor control. Elsevier; Amsterdam: 1992. pp. 3–31.
    1. Chao EYS, An KN, Cooney WP, Linschied RL. A basic research study. World Scientific Publishing; Teaneack, NJ: 1989. Biomechanics of the hand.
    1. Christou EA. Visual feedback attenuates force fluctuations induced by a stressor. Med Sci Sports Exerc. 2005;37:2126–2133. - PubMed

Publication types

LinkOut - more resources