. 2009 Aug;27(8):1836-46.
doi: 10.1002/stem.129.

A targeted neuroglial reporter line generated by homologous recombination in human embryonic stem cells

Affiliations

A targeted neuroglial reporter line generated by homologous recombination in human embryonic stem cells

Haipeng Xue et al. Stem Cells. 2009 Aug.

Abstract

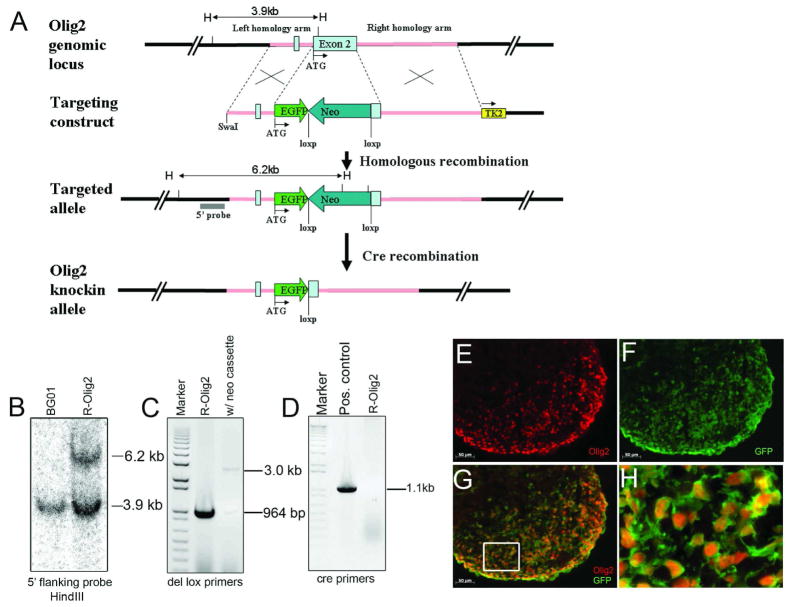
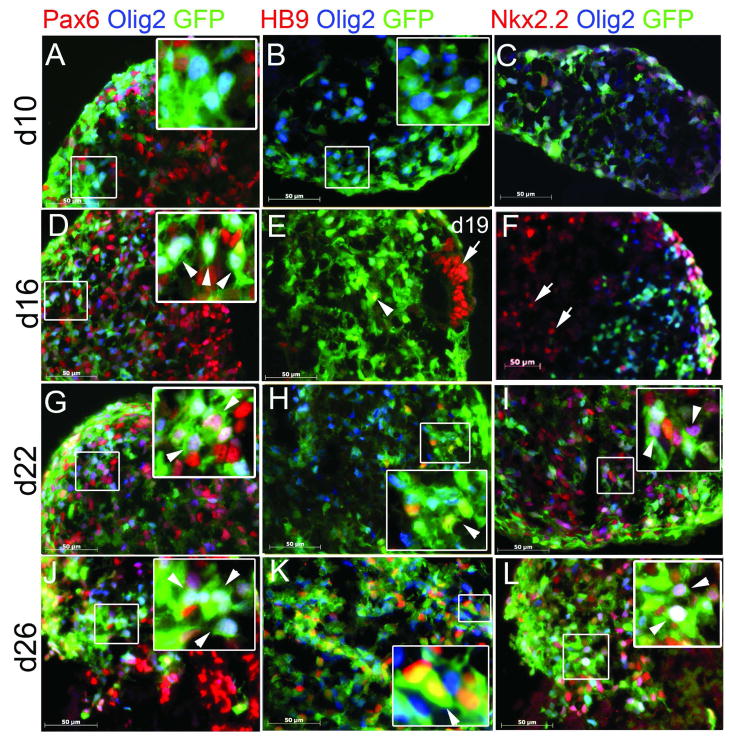
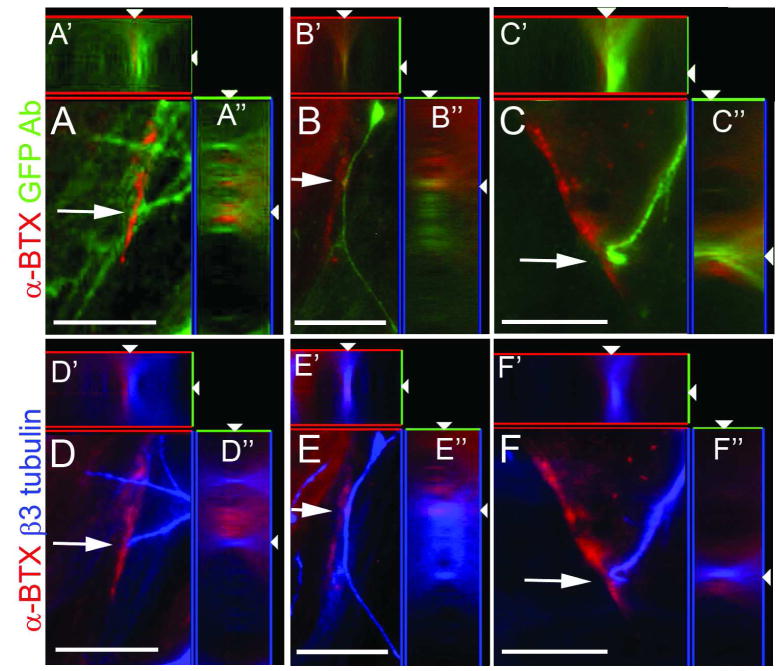
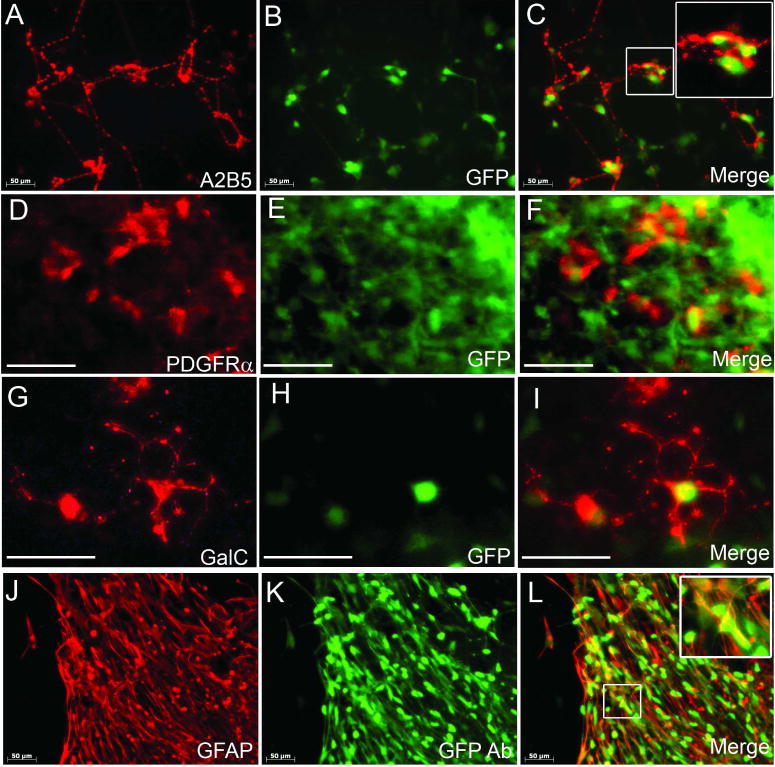
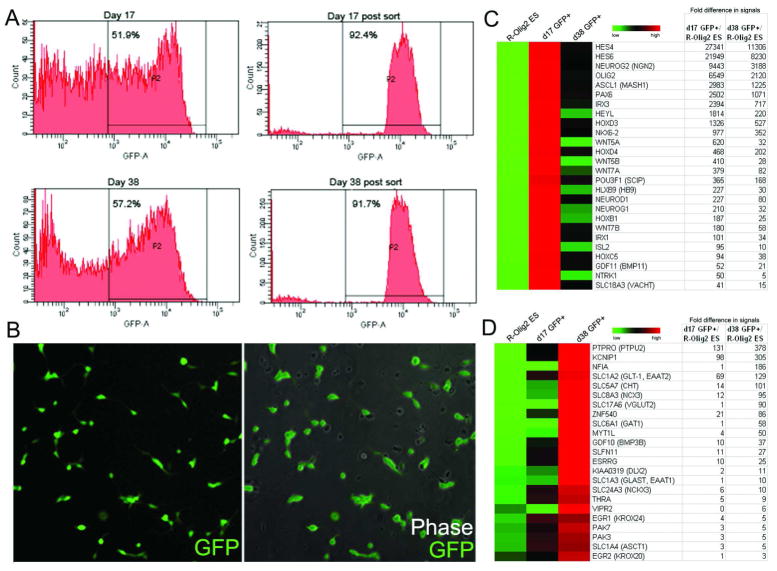
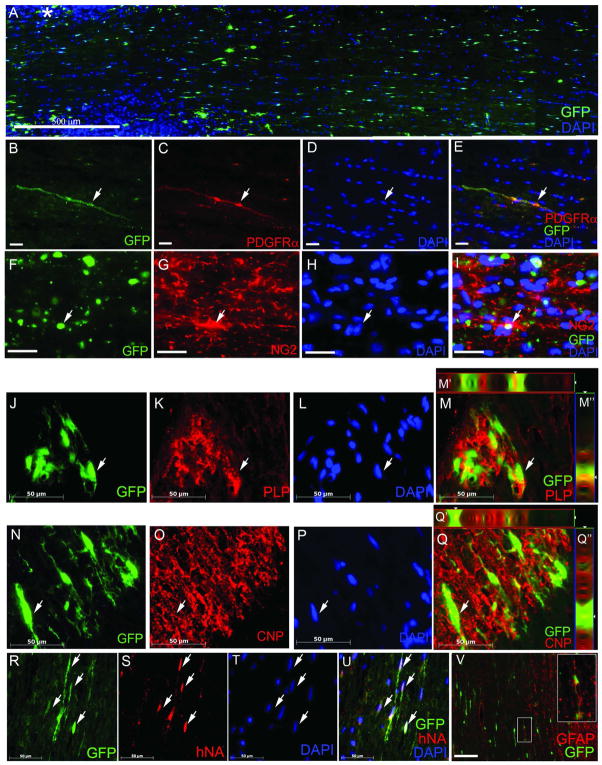
In this study, we targeted Olig2, a basic helix-loop-helix transcription factor that plays an important role in motoneuron and oligodendrocyte development, in human embryonic stem cell (hESC) line BG01 by homologous recombination. One allele of Olig2 locus was replaced by a green fluorescent protein (GFP) cassette with a targeting efficiency of 5.7%. Targeted clone R-Olig2 (like the other clones) retained pluripotency, typical hESC morphology, and a normal parental karyotype 46,XY. Most importantly, GFP expression recapitulated endogenous Olig2 expression when R-Olig2 was induced by sonic hedgehog and retinoic acid, and GFP-positive cells could be purified by fluorescence-activated cell sorting. Consistent with previous reports on rodents, early GFP-expressing cells appeared biased to a neuronal fate, whereas late GFP-expressing cells appeared biased to an oligodendrocytic fate. This was corroborated by myoblast coculture, transplantation into the rat spinal cords, and whole genome expression profiling. The present work reports an hESC reporter line generated by homologous recombination targeting a neural lineage-specific gene, which can be differentiated and sorted to obtain pure neural progenitor populations.


Figures

Figure 1
Figure 1
Successful gene targeting of GFP cassette into the Olig2 locus in the hESC line BG01. Homologous recombination was performed using a GFP vector that targets the Olig2 gene in BG01 (A). Pink line represents the homology arms and two light blue boxes represent the two exons of Olig2. EGFP cassette is shown in green. Neo (dark blue box) and Tk2 (yellow box) cassettes are designed for positive and negative selection respectively. Restriction enzyme HindIII (abbreviated as “H” in panel A) was used to digest the genomic DNA of hESC clones for Southern blot analysis. Six clones were identified to be correctly targeted to the Olig2 locus by Southern blot using a 5′ flanking probe. R-Olig2, the representative clone is shown with a 6.2 kb band of targeted allele and a 3.9kb band for the wild type allele, as predicted (B). Floxed neo cassette was further removed by transient transfection of a Cre construct (C) and displayed absence of genomic integration of Cre fragment by PCR (D). To examine GFP expression, R-Olig2 cells were induced by Shh agonist and retinoic acid for 16 days before differentiated spheres were fixed, sectioned and stained with Olig2 antibody (E). All cells that were labeled with Olig2 antibody co-expressed GFP (F, G), which was directly visualized under fluorescence microscope. Panel H shows higher magnification of the boxed area in G. Bar, 50 μm.
Figure 2
Figure 2
GFP expression reflects endogenous Olig2 expression along the neural differentiation pathway. R-Olig2 cells were induced with Shh agonist and retinoic acid and the expression of transcription factors Olig2, Pax6 (A, D, G, J), HB9 (B, E, H, K) and Nkx2.2 (C, F, I, L) was examined by immunocytochemistry along with GFP expression (direct visualization under fluorescence microscope) at d10, d16, d22 and d26 of differentiation. Pax6 was first detected at d10 (red, A) and starting at d16, a subset of Pax6+ cells co-expressed Olig2 and GFP (arrowheads, D, G, J). Although Olig2 and GFP expression was detected as early as d10, almost no expression was detected for motoneuron marker HB9 (B), until d19 of differentiation (arrow, E), when the majority of cells did not co-express HB9 and Olig2. Some HB9+ cells co-expressed GFP but not Olig2 (arrowheads, E, H, K). Nkx2.2 did not co-label with Olig2 or GFP at the early stages of differentiation (arrow, C, F), and the initiation of co-expression of Nkx2.2 and Olig2 and GFP could be observed starting from d22 (arrowheads, I, L). Insets show higher magnification images of boxed areas in corresponding panels. Detailed time course images are shown in Supplementary Figures 2–4. Bar, 50 μm.
Figure 3
Figure 3
Early GFP-expressing cells are likely motoneuron precursors which have the ability to make synapses. Twenty-one-day differentiated GFP+ spheres were harvested and co-cultured with C2C12 myoblasts for 5–10 days. GFP+ cells were able to cause acetylcholine receptor aggregation, as detected by staining using an antibody against α-BTX (arrows, panels A and D, B and E, and C and D show aggregations of three representative fields at the neuromuscular junction). Although cell bodies of the motoneurons were still weakly visible under green fluorescence microscopy, GFP expression in most neuron processes was downregulated as cells matured. Antibodies of GFP (A–C) and βIII tubulin (blue, D–F) were used to delineate the cell bodies and processes of these GFP+ cell-derived motoneurons. Images of z stacks were taken at 1 μm increments and A′–F′ and A″–F″ are xz and yz views processed by Zeiss Axiovision software. GFP Ab: GFP antibody. Bar, 25 μm.
Figure 4
Figure 4
Late stage GFP+ cells are likely glial precursors and give rise to oligodendrocytes and astrocytes. Thirty-five-day differentiated GFP+ spheres were harvested and seeded on fibronectin and further induced by PDGFAA, T3 and Shh agonist for 5 days. Cells expressed GFP (B, E, direct fluorescence) and glial progenitor markers A2B5 (A) and PDGFRα (D). Merged images (C, F) show co-expression. When further induced, GFP+ cells (H, direct fluorescence) gave rise to GalC+ oligodendrocytes (G-I) and GFAP+ astrocytes (J-L). While a small subpopulation of GFAP+ cells still expressed GFP, which were visualized directly by fluorescence microscopy (Supplementary Figure 5), in most GFAP+ astrocytes, GFP expression was revealed by antibody staining (K, L). GFP Ab: GFP antibody. Insets in C and L show higher magnification images of the boxed area. Bar, 50 μm.
Figure 5
Figure 5
Early and late stage GFP+ cells show distinct gene expression profile. GFP+ cells derived from R-Olig2 at early (day 17) and late (day 38) stages were purified by FACS (A) for gene expression profile analysis. Cells maintained GFP expression after sorting (B, direct fluorescence) and showed distinct global gene expression profiles. When compared to undifferentiated R-Olig2 ES cells, GFP+ cells from early stage showed high expression of genes of the motoneuron lineage (C), while those from a later stage showed an upregulation of genes of the oligodendrocyte lineage (D). In the heatmaps, high expression levels relative to mean values (average signals of ES, d17 and d38 of the corresponding genes) are colored red. Low expression levels are colored green. Black represents no significant change in the expression level between mean and sample. Fold increase of gene expression level of d17 and d38 GFP+ cells compared to undifferentiated R-Olig2 ES cells is listed in the tables in C and D.
Figure 6
Figure 6
Engrafted late stage GFP+ cells migrated and differentiated into oligodendrocyte progenitors and oligodendrocytes after transplantation into the rat spinal cords. Engrafted GFP+ cells survived, migrated and integrated into the host white matter regions of the cervical spinal cord robustly as identified by GFP (A) and an antibody against human nuclear antigen (hNA) (arrows, R-U). Specifically, at 2 weeks posttransplantation, engrafted cells co-expressed GFP and oligodendrocyte precursor markers PDGFRα (arrow, B-E) and NG2 (arrow, F-I). By 6 weeks posttransplantation, cells continued to express GFP, migrated further from the injection site (*, A) and started to myelinate the host tissue, as evidenced by co-expression of GFP and PLP (arrow, J-M″), and GFP and CNP (arrow, N-Q″). Some transplanted cells differentiated into astrocytes as detected by GFAP staining (V, inset shows higher magnification of the boxed area). For panels J-Q″, z stack images were taken at 1 μm increments. M′ and Q′ and M″-Q″ are images of xz and yz views processed by Zeiss Axiovision software. GFP was directly visualized under fluorescence microscopy. Bar in A, 500 μm, B–E and J–V, 50 μm, F–I, 20 μm.

References

    1. Thomson JA, Itskovitz-Eldor J, Shapiro SS, et al. Embryonic stem cell lines derived from human blastocysts. Science. 1998;282:1145–1147. - PubMed
    1. Thomas KR, Capecchi MR. Site-directed mutagenesis by gene targeting in mouse embryo-derived stem cells. Cell. 1987;51:503–512. - PubMed
    1. Davis RP, Ng ES, Costa M, et al. Targeting a GFP reporter gene to the MIXL1 locus of human embryonic stem cells identifies human primitive streak-like cells and enables isolation of primitive hematopoietic precursors. Blood. 2008;111:1876–1884. - PubMed
    1. Ruby KM, Zheng B. Gene Targeting in a HUES Line of Human Embryonic Stem Cells via Electroporation. Stem Cells. 2009 - PubMed
    1. Urbach A, Schuldiner M, Benvenisty N. Modeling for Lesch-Nyhan disease by gene targeting in human embryonic stem cells. Stem Cells. 2004;22:635–641. - PubMed

Publication types

MeSH terms

Substances