. 2009 Jun 22:10:64.
doi: 10.1186/1471-2202-10-64.

Impairment of mitochondrial calcium handling in a mtSOD1 cell culture model of motoneuron disease

Affiliations

Impairment of mitochondrial calcium handling in a mtSOD1 cell culture model of motoneuron disease

Manoj Kumar Jaiswal et al. BMC Neurosci. .

Abstract

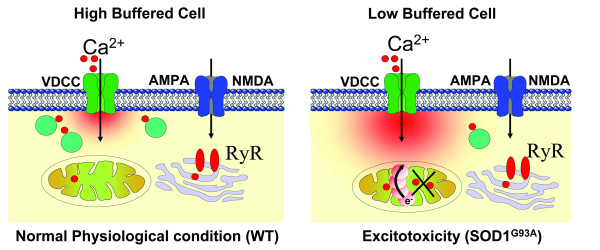
Background: Amyotrophic lateral sclerosis (ALS) is a fatal neurodegenerative disorder characterized by the selective loss of motor neurons (MN) in the brain stem and spinal cord. Intracellular disruptions of cytosolic and mitochondrial calcium have been associated with selective MN degeneration, but the underlying mechanisms are not well understood. The present evidence supports a hypothesis that mitochondria are a target of mutant SOD1-mediated toxicity in familial amyotrophic lateral sclerosis (fALS) and intracellular alterations of cytosolic and mitochondrial calcium might aggravate the course of this neurodegenerative disease. In this study, we used a fluorescence charged cool device (CCD) imaging system to separate and simultaneously monitor cytosolic and mitochondrial calcium concentrations in individual cells in an established cellular model of ALS.

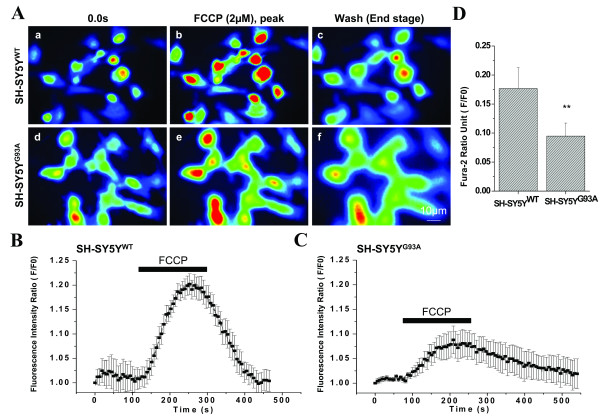
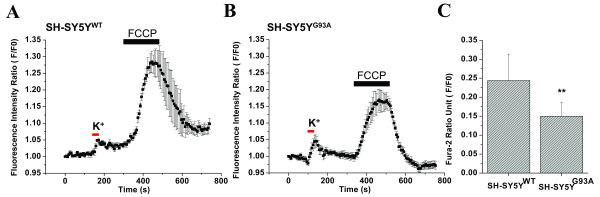
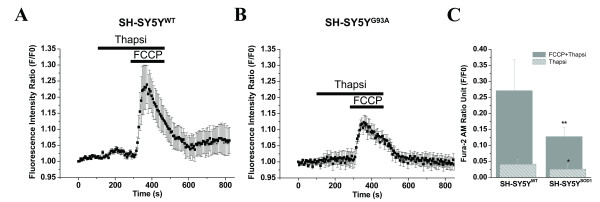
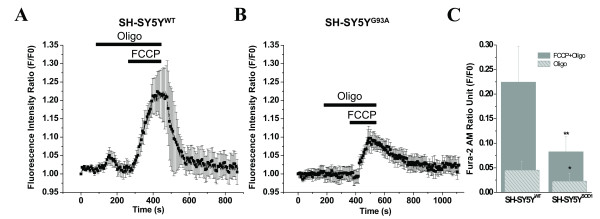
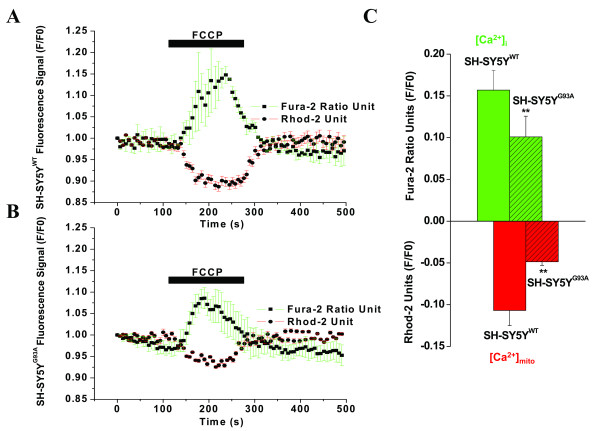
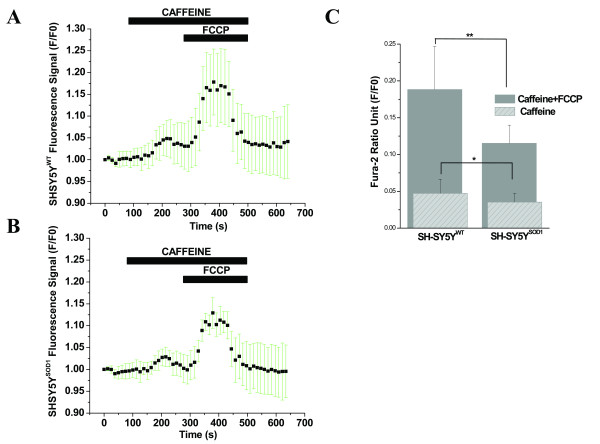
Results: To gain insights into the molecular mechanisms of SOD1(G93A) associated motor neuron disease, we simultaneously monitored cytosolic and mitochondrial calcium concentrations in individual cells. Voltage - dependent cytosolic Ca2+ elevations and mitochondria - controlled calcium release mechanisms were monitored after loading cells with fluorescent dyes fura-2 and rhod-2. Interestingly, comparable voltage-dependent cytosolic Ca2+ elevations in WT (SH-SY5Y(WT)) and G93A (SH-SY5Y(G93A)) expressing cells were observed. In contrast, mitochondrial intracellular Ca2+ release responses evoked by bath application of the mitochondrial toxin FCCP were significantly smaller in G93A expressing cells, suggesting impaired calcium stores. Pharmacological experiments further supported the concept that the presence of G93A severely disrupts mitochondrial Ca2+ regulation.

Conclusion: In this study, by fluorescence measurement of cytosolic calcium and using simultaneous [Ca2+]i and [Ca2+]mito measurements, we are able to separate and simultaneously monitor cytosolic and mitochondrial calcium concentrations in individual cells an established cellular model of ALS. The primary goals of this paper are (1) method development, and (2) screening for deficits in mutant cells on the single cell level. On the technological level, our method promises to serve as a valuable tool to identify mitochondrial and Ca2+-related defects during G93A-mediated MN degeneration. In addition, our experiments support a model where a specialized interplay between cytosolic calcium profiles and mitochondrial mechanisms contribute to the selective degeneration of neurons in ALS.


Figures

Figure 1
Figure 1
FCCP induced mitochondrial depolarization in SH-SY5Y neuroblastoma cells transfected with G93A exhibits reduced peak fluorescence amplitude. A) A CCD imaging photomicrograph series showing [Ca2+]i in 7–8 cells before drug application (0.0s), after peak 2 μM FCCP challenge for 3 min, and after FCCP wash in WT (a-c) and G93A (d-f) transfected SH-SY5Y neuroblastoma cells. B) A representative figure of [Ca2+]i fluorescence intensity in 6 SH-SY5Y neuroblastoma cells transfected with WT after FCCP application. FCCP (2 μM) induced a fast, transient elevation in [Ca2+]i and a fast recovery to baseline. C) In G93A transfected SH-SY5Y neuroblastoma cells, FCCP induced a transient elevation in [Ca2+]i fluorescence intensity that was lower in magnitude, followed by a plateau for 1 min, and a delayed recovery to baseline. D) A bar diagram to illustrate the reduction of the sustained Ca2+ response in G93A transfected SH-SY5Y neuroblastoma cells (F/F0 = 0.0948 ± 0.0223; N = 5, n = 23) compared to WT transfected SH-SY5Y cells (F/F0 = 0.1766 ± 0.0362; N = 3, n = 17). Values represent means ± SD, **p < 0.001, scale bar = 10 μm. N = Number of experiments; n = Number of cells.
Figure 2
Figure 2
The effect of high K+ (30 mM) – evoked Ca2+ transient and its impact on the FCCP-induced Ca2+ influx in WT and G93A transfected SH-SY5Y neuroblastoma cells. A) A representative figure showing effect of perturbing the mitochondrial Ca2+ uptake on the calcium transient evoked by 30 mM K+ depolarizing stimulus for 30s (red horizontal bar) and by 2 μM FCCP-evoked Ca2+ efflux (black horizontal bar). FCCP (2 μM) induced a fast, transient elevation in [Ca2+]i and a fast recovery to baseline after depolarization-induced stimulus in 7 SH-SY5Y cells transfected with WT. B) In G93A transfected SH-SY5Y cells, the FCCP-induced [Ca2+]i transient elevation after depolarization-induced stimulus was delayed 5–10s and there was a reduction in the magnitude of fluorescence intensity followed by complete recovery to baseline. C) A bar diagram to illustrate the reduction of the sustained Ca2+ response in G93A transfected SH-SY5Y neuroblastoma cells (F/F0 = 0.1497 ± 0.0362; N = 5, n = 20) compared to WT transfected SH-SY5Y cells (F/F0 = 0.2440 ± 0.0696; N = 3, n = 20). Values represent means ± SD, **p < 0.001, scale bar = 20 μm. N = Number of experiments; n = Number of cells.
Figure 3
Figure 3
Analysis of the differential Ca2+ storage and regulation of the ER and mitochondria by pharmacological intervention in WT and G93A transfected SH-SY5Y cells. Cells were stimulated using thapsi and FCCP, which interfere with the integrity of the ER and mitochondria, respectively, and were used to release Ca2+ from intracellular stores by inhibition of the sarcoplasmic/endoplasmic reticulm Ca2+-dependent ATPase pump and mitochondrial stores by protonophore action. A) The quantitative kinetic profile of the thapsi and FCCP-evoked [Ca2+]i release in WT transfected SH-SY5Y cells. B) The corresponding quantitative kinetic profile of the thapsi and FCCP-evoked [Ca2+]i release in the G93A transfected SH-SY5Y cells. The trace is representative of mean of 4–6 cells in focus stimulated with thapsi (5 μg/ml; 6 min) and 2 μM FCCP (3 min, normalized data). The horizontal black bars indicate the duration of stimulation by thapsi and with FCCP plus thapsi. Fura-2 AM signals are represented as F/F0. C) A bar diagram of thapsi and FCCP plus thapsi-induced Ca2+ release in the WT and G93A transfected SH-SY5Y neuroblastoma cells (N = 3, n = 15). Gray bars represent thapsi plus FCCP-induced Ca2+ release in WT (F/F0 = 0.2712 ± 0.0971) and G93A (F/F0 = 0.1276 ± 0.0287) transfected SH-SY5Y cells. Striped bars represent thapsi-induced Ca2+ release in WT (F/F0 = 0.0412 ± 0.0152) and G93A (F/F0 = 0.0258 ± 0.0137) transfected cells. Values represent means ± SD, *p < 0.01, **p < 0.001. N = Number of experiments; n = Number of cells.
Figure 4
Figure 4
Impact of inhibition of F1, F0-ATP synthase on FCCP-evoked responses of [Ca2+]i in WT and G93A transfected SH-SY5Y cells. A) The quantitative kinetic profile of the oligo and FCCP-evoked [Ca2+]i release in WT transfected SH-SY5Y cells. B) The corresponding quantitative kinetic profile of the oligo and FCCP-evoked [Ca2+]i release in the G93A transfected SH-SY5Y cells. The trace is representative of mean of 4-6 cells in focus stimulated with oligo (5 μg/ml; 6 min) and 2µM FCCP (3 min, normalized data). The horizontal black bars indicate the duration of stimulation by oligo and with FCCP plus oligo. Fura-2 AM signals are represented as F/F0. C) A bar diagram of oligo and FCCP plus oligo-induced Ca2+ release in the WT (N=3, n=20) and G93A (N=3, n=19) transfected SH-SY5Y neuroblastoma cells. Gray bars represent oligo plus FCCP-induced Ca2+ release in WT (F/F0 = 0.2245 ± 0.0727) and G93A (F/F0 = 0.0827 ± 0.0304) transfected SH-SY5Y cells. Striped bars represent oligo-induced Ca2+ release in WT (F/F0 = 0.0454 ± 0.0175) and G93A (F/F0 = 0.0229 ± 0.0161) transfected cells. Values represent means ± SD, *p<0.01, **p<0.001. N= Number of experiments; n= Number of cells.
Figure 5
Figure 5
The simultaneous measurement of cytosolic (Fura-2) and mitochondrial (Rhod-2) calcium concentrations in WT and G93A transfected transfected SH-SY5Y cells during FCCP-evoked mitochondrial Ca2+ release. A) The kinetic profile of the FCCP-evoked Ca2+ release in the WT transfected SH-SY5Y neuroblastoma cells; the cytosolic (Error bar green, black square trace) and mitochondrial (Error bar red, black circle trace) compartment were measured simultaneously. The trace represents the mean of 5 cells in focus stimulated with 2µM FCCP (5 point smoothing). B) The corresponding kinetic profile of the FCCP-evoked Ca2+ release in the G93A transfected SH-SY5Y neuroblastoma cells; the cytosolic (Error bar green, black square trace) and mitochondrial (Error bar red, black circle trace) compartment were measured simultaneously. The trace represents the mean of 5 cells in focus stimulated with 2µM FCCP (5 point smoothing). FCCP-evoked [Ca2+]mito signals were smaller in amplitude and exhibited slower kinetics in G93A transfected SH-SY5Y cells compared to WT transfected cells and were altered from [Ca2+]i efflux. C) A bar diagram of the cytosolic (green bar) and mitochondrial (red bar) fluorescence signals (F/F0) from WT (F/F0 = 0.1569 ± 0.0235 for [Ca2+]i and F/F0 = -0.1069 ± 0.0181 for [Ca2+]mito; hollow; N=5, n=17) and G93A (F/F0 = 0.1008 ± 0.0248 for [Ca2+]i and F/F0 = -0.0486 ± 0.0043 for[Ca2+]mito; striped pattern, N=4; n=17) transfected SH-SY5Y neuroblastoma cells. Values represent means ± SD, **p<0.001. N= Number of experiments; n= Number of cells.
Figure 6
Figure 6
Caffeine stimulates [Ca2+]i release with slower kinetics and weaker transient than the FCCP-evoked [Ca2+]i signals in SH-SY5Y neuroblastoma cells, particularly in WT transfected cells compared to G93A transfected cells. A) The kinetic profile of caffeine and FCCP-evoked [Ca2+]i release in the WT transfected SH-SY5Y neuroblastoma cells. The trace is representative of 5 cells in focus stimulated with 5mM caffeine and 2µM FCCP (normalized data, 5 point smoothing). B) The corresponding kinetic profile of the caffeine and FCCP-evoked [Ca2+]i release in the G93A transfected SH-SY5Y cells. The trace is representative of 5 cells in focus stimulated with 5mM caffeine and 2µM FCCP (normalized data, 5 point smoothing). The ER and mitochondrial Ca2+ release from these two compartments were measured simultaneously. The horizontal black bars indicate the duration of stimulation by caffeine and with FCCP plus caffeine. Fura-2 AM signals are represented as F/F0. C) A bar diagram of caffeine and FCCP plus caffeine-induced Ca2+ release in the WT and G93A transfected SH-SY5Y neuroblastoma cells (N=3, n=14). Gray bars represent caffeine plus FCCP-induced Ca2+ release in WT (F/F0 = 0.1883 ± 0.0584) and G93A (F/F0 = 0.1154 ± 0.0246) transfected SH-SY5Y cells. Striped bars represent caffeine-induced Ca2+ release in WT (F/F0 = 0.0471 ± 0.0190) and G93A (F/F0 = 0.0353 ± 0.0120) transfected cells. Values represent means ± SD, *p<0.01, **p<0.001. N= Number of experiments; n= Number of cells.
Figure 7
Figure 7
Low Ca2+ buffering and excitotoxicity under physiological stress and pathophysiological conditions in motor neuron (MNs). Low Ca2+ buffering in amyotrophic lateral sclerosis (ALS) vulnerable hypoglossal MNs exposes mitochondria to higher Ca2+ loads compared to highly buffered cells. Under normal physiological conditions, the neurotransmitter opens glutamate, NMDA and AMPA receptor channels, and voltage dependent Ca2+ channels (VDCC) with high glutamate release, which is taken up again by EAAT1 and EAAT2. This results in a small rise in intracellular calcium that can be buffered in the cell. In ALS, a disorder in the glutamate receptor channels leads to high calcium conductivity, resulting in high Ca2+ loads and increased risk for mitochondrial damage. This triggers the mitochondrial production of reactive oxygen species (ROS), which then inhibit glial EAAT2 function. This leads to further increases in the glutamate concentration at the synapse and further rises in postsynaptic calcium levels, contributing to the selective vulnerability of MNs in ALS.

Similar articles

Cited by

References

    1. Bruijn LI, Houseweart MK, Kato S, Anderson KL, Anderson SD, Ohama E, Reaume AG, Scott RW, Cleveland DW. Aggregation and motorneuron toxicity of an ALS-linked SOD1 mutant independent from wildtype SOD1. Science. 1998;281:1851–1854. doi: 10.1126/science.281.5384.1851. - DOI - PubMed
    1. Rowland LP, Shneider NA. Amyotrophic Lateral Sclerosis. N Engl J Med. 2001;344:1688–1700. doi: 10.1056/NEJM200105313442207. - DOI - PubMed
    1. Rosen DR, Siddique T, Patterson D, Figlewicz DA, Sapp P, Hentati A, Donaldson D, Goto J, O'Regan JP, Deng HX, et al. Mutations in Cu/Zn superoxide dismutase gene are associated with familial amyotrophic lateral sclerosis. Nature. 1993;362:59–62. doi: 10.1038/362059a0. - DOI - PubMed
    1. Rosen DR, Bowling AC, Patterson D, Usdin TB, Sapp P, Mezey E, McKenna-Yasek D, O'Regan J, Rahmani Z, Ferrante RJ, et al. A frequent ala 4 to val superoxide dismutase-1 mutation is associated with a rapidly progressive familial amyotrophic lateral sclerosis. Hum Mol Genet. 1994;3:981–7. doi: 10.1093/hmg/3.6.981. - DOI - PubMed
    1. Gurney ME, Pu H, Chiu AY, Dal Canto MC, Polchow CY, Alexander DD, Caliendo J, Hentati A, Kwon YW, Deng H-X, Chen W, Zhai P, Sufit RL, Siddique T. Motor neuron degeneration in mice that express a human Cu, Zn superoxide dismutase. Science. 1994;264:1772–1775. doi: 10.1126/science.8209258. - DOI - PubMed

Publication types