. 2009 Aug 28;284(35):23286-92.
doi: 10.1074/jbc.M109.028191. Epub 2009 Jun 22.

Modulating estrogen receptor-related receptor-alpha activity inhibits cell proliferation

Affiliations

Modulating estrogen receptor-related receptor-alpha activity inhibits cell proliferation

Stéphanie Bianco et al. J Biol Chem. .

Abstract

High expression of the estrogen receptor-related receptor (ERR)-alpha in human tumors is correlated to a poor prognosis, suggesting an involvement of the receptor in cell proliferation. In this study, we show that a synthetic compound (XCT790) that modulates the activity of ERRalpha reduces the proliferation of various cell lines and blocks the G(1)/S transition of the cell cycle in an ERRalpha-dependent manner. XCT790 induces, in a p53-independent manner, the expression of the cell cycle inhibitor p21(waf/cip)(1) at the protein, mRNA, and promoter level, leading to an accumulation of hypophosphorylated Rb. Finally, XCT790 reduces cell tumorigenicity in Nude mice.


Figures

FIGURE 1.
FIGURE 1.
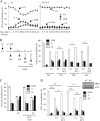
XCT790 inhibits cell proliferation and tumorigenicity. A, after culture for 3 days in the absence of estrogens, MCF7 cells were treated with E2 (10−8 m), XCT790 (5 × 10⁻⁶ m), or both as indicated. Cell proliferation was estimated after 1, 3, and 5 days. B, same as above counting the number of BrdUrd-positive cells after 24 h of drug treatment. C, E2-stimulated MCF7 cells were treated with the indicated XCT790 concentration. Proliferation was estimated after 5 days. Data are expressed relative to E2-treated controls. D, expression of ERRα protein in the cell lines used in this study is shown in the upper panel (actin is used as a loading control). MDA-MB231 or PC3 cells (lower left and middle panels, respectively) were treated with XCT790, and cell proliferation was estimated after 5 days. Lower right panel, after culture for 3 days in the absence of steroid hormones, LNCaP cells were treated with epidermal growth factor (100 ng/ml), XCT790, or both as indicated, and cell proliferation was measured after 4 days. Experiments were performed in triplicate; data are expressed relative to unstimulated control with error bars representing S.D. E, 2 × 10⁶ MELN cells were treated with XCT790 for 24 h before injection subcutaneously in the right flank of Nude mice. Untreated cells were injected contralaterally. Left panel, implanted cells originating luciferase activities were visualized 8 weeks after implantation (a single representative animal is shown). White arrow, untreated cells; black arrowhead, XCT790-treated cells. Right panel, tumor volumes were measured manually at the indicated times after cell graft. All 6 mice (out of 10 grafted) in which tumors were measurable are reported in the graph, which represents that mean tumor volume with error bars representing S.E. One-way analysis of variance was performed, comparing control and XCT790-pretreated tumors at each time point. *, p < 0.05; ***, p < 0.005; ns, not significant.
FIGURE 2.
FIGURE 2.
XCT790 inhibits G1-to-S phase transition. A, after culture for 3 days in the absence of estrogens, MCF7 cells were treated with E2 (left panel) or E2 + XCT790 (right panel) and were examined for cell cycle distribution by fluorescence-activated cell sorter at the indicated times. B, cell cycle block by XCT790 is G1-specific. A schematic representation of the experiment is shown in the left panel. MCF7 cells were induced for G1-S transition by E2 treatment, and XCT790 was added or not after 24 h (when cells were in S phase). Cell cycle distribution was determined 24, 36, 40, or 44 h after E2 addition. C, XCT790 effect is reversible. Cells were treated or not with XCT790 for 72 h and then washed before E2 addition. Cell cycle distribution was determined 24 h later. D, XCT790 requires ERRα to block cells in G1 phase. Cells were transfected with ERRα-specific or control siRNA (siE and siC, respectively) and then drug-treated as indicated. Cell cycle distribution after 24 h is depicted. Inset, effect of the siRNAs on ERRα was determined by Western blotting using actin as a control. Graphs represent typical experiments performed in triplicate with error bars indicating S.D. One-way analysis of variance was performed on G1 percentage. ns, not significant; *, p < 0.05; ***, p < 0.005.
FIGURE 3.
FIGURE 3.
XCT790 induces the expression of p21 in an ERRα-dependent, p53-independent manner. A, MCF7 cells were treated with E2 or E2 + XCT790 (E2X). p21 expression was analyzed by Western blotting at the indicated times, using actin as a control. B, Rb phosphorylation was analyzed after 24 h of drug exposure (Rb and P-Rb, hypo- and hyperphosphorylated Rb isoforms, respectively). C, cells were independently transfected with two ERRα-specific (siE1 and siE2) or control siRNA (siC). Extinction of ERRα (but not that of ERα) expression was verified after 72 h (left panel). Cells were then treated as indicated for 24 h after which p21 expression was determined by Western blotting using actin as a control. D, WT- or p53-deficient MCF7 cells were treated for 24 h with E2 or E2 + XCT790. p21 and p53 expression were analyzed by Western blotting, using actin as a control. Shown are single representative experiments (out of three). E, after culture for 3 days in the absence of estrogens, WT or p53-deficient MCF7 cells were treated by E2 or E2 + XCT790. Percentage of cells in GO/G1 was analyzed after 24 h. Shown is a single representative experiment, performed in triplicate. Error bars represent S.D.
FIGURE 4.
FIGURE 4.
XCT790 stimulates p21 mRNA expression and promoter activity. A, MCF7 cells were treated by E2 or E2 + XCT790 for the indicated times. p21 mRNA expression was analyzed by quantitative PCR. The experiment was performed in triplicate, and data are expressed relative to unstimulated control with error bars representing S.D. B, schematic representation of the p21 promoter derivatives used. Details of the mutations can be found in Ref. . White and black boxes represent wild type and mutant (respectively) Sp1 sites. Arrows represent the position of the primer used in chromatin immunoprecipitation below. C, MCF7 cells were transfected with the indicated promoter constructs together with the indicated amounts of ERRα-encoding plasmid and treated or not with XCT790 as indicated. pS2 promoter was used as a control. Transfections were performed three times in triplicate and included a CMV-β-Gal vector. Luciferase activity is expressed relative to β-galactosidase activity. For each promoter construct, data are expressed relative to the reporter vector transfected alone and unstimulated. The graphs represent a single experiment performed in triplicate with error bars indicating S.D. D, chromatin immunoprecipitation at the p21 (left panel) and pS2 promoters (right panel). MCF7 cells were treated as indicated. Chromatin was immunoprecipitated with the indicated antibodies and submitted to quantitative PCR. Results are expressed as fold enrichment over IgG-immunoprecipitated material. A typical experiment is shown with error bars representing S.D. Pol II, polymerase II.

References

    1. McPherson K., Steel C. M., Dixon J. M. (2000) Br. Med. J. 321,624–628 - PMC - PubMed
    1. Foster J. S., Henley D. C., Ahamed S., Wimalasena J. (2001) Trends Endocrinol. Metab. 12,320–327 - PubMed
    1. Doisneau-Sixou S. F., Sergio C. M., Carroll J. S., Hui R., Musgrove E. A., Sutherland R. L. (2003) Endocr.-Relat. Cancer 10,179–186 - PubMed
    1. Massagué J. (2004) Nature 432,298–306 - PubMed
    1. Lin N. U., Winer E. P. (2008) J. Clin. Oncol. 26,798–805 - PubMed

Publication types