. 2009 Aug;29(16):4467-83.
doi: 10.1128/MCB.00192-09. Epub 2009 Jun 22.

Hypoxia-inducible factor 1alpha induces fibrosis and insulin resistance in white adipose tissue

Affiliations

Hypoxia-inducible factor 1alpha induces fibrosis and insulin resistance in white adipose tissue

Nils Halberg et al. Mol Cell Biol. 2009 Aug.

Abstract

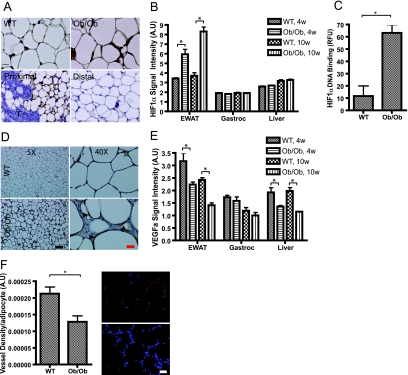
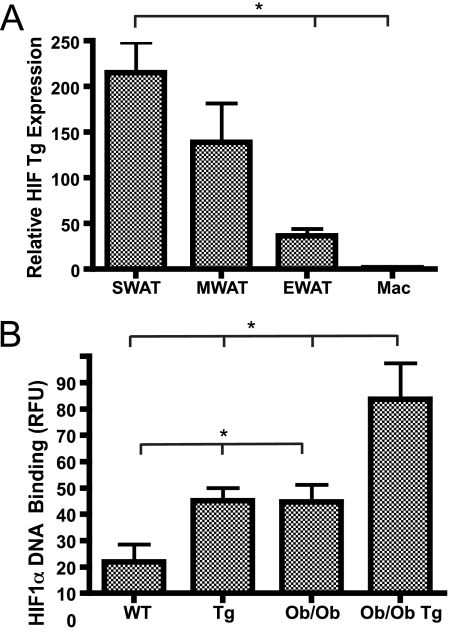
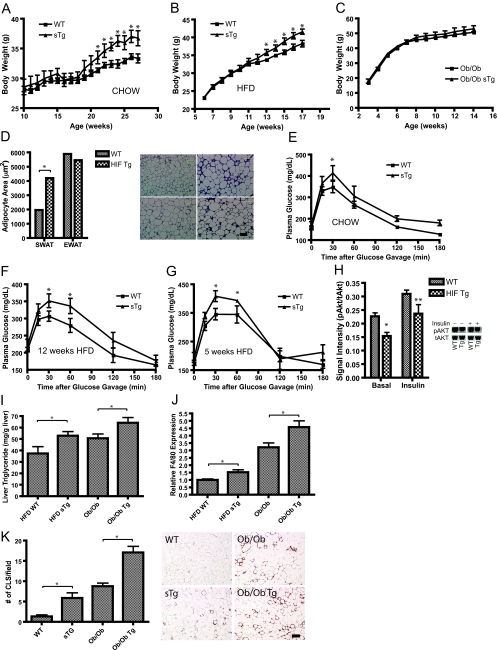
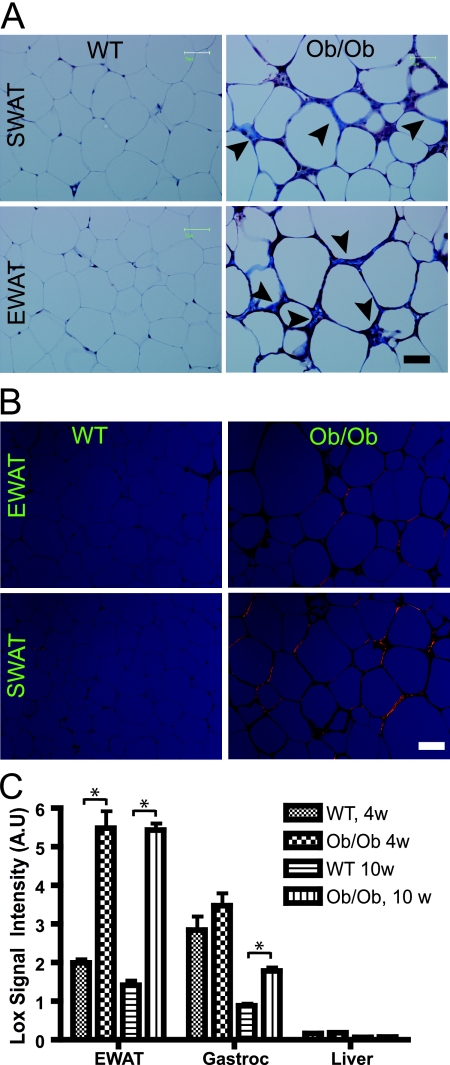
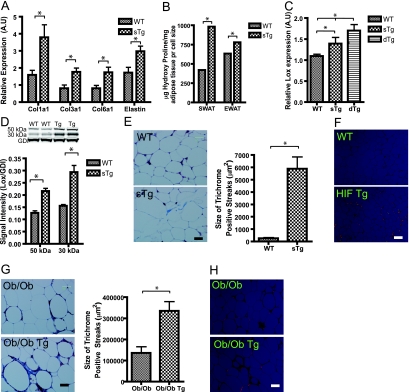
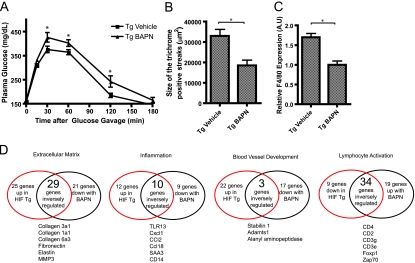
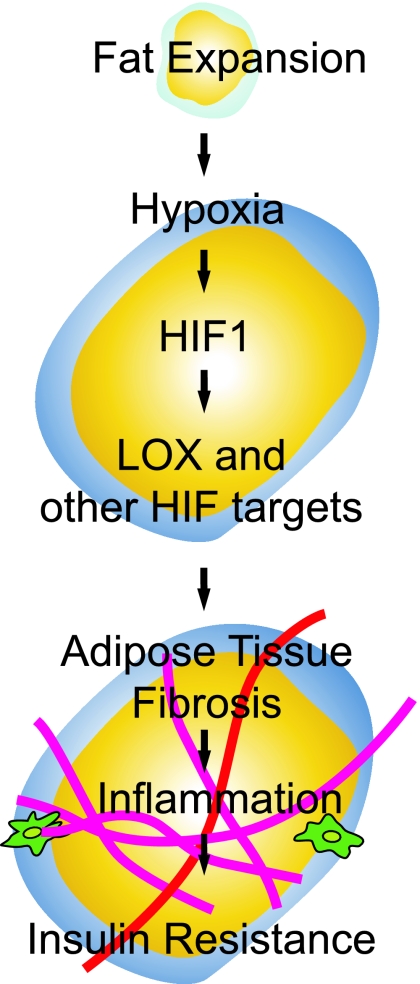
Adipose tissue can undergo rapid expansion during times of excess caloric intake. Like a rapidly expanding tumor mass, obese adipose tissue becomes hypoxic due to the inability of the vasculature to keep pace with tissue growth. Consequently, during the early stages of obesity, hypoxic conditions cause an increase in the level of hypoxia-inducible factor 1alpha (HIF1alpha) expression. Using a transgenic model of overexpression of a constitutively active form of HIF1alpha, we determined that HIF1alpha fails to induce the expected proangiogenic response. In contrast, we observed that HIF1alpha initiates adipose tissue fibrosis, with an associated increase in local inflammation. "Trichrome- and picrosirius red-positive streaks," enriched in fibrillar collagens, are a hallmark of adipose tissue suffering from the early stages of hypoxia-induced fibrosis. Lysyl oxidase (LOX) is a transcriptional target of HIF1alpha and acts by cross-linking collagen I and III to form the fibrillar collagen fibers. Inhibition of LOX activity by beta-aminoproprionitrile treatment results in a significant improvement in several metabolic parameters and further reduces local adipose tissue inflammation. Collectively, our observations are consistent with a model in which adipose tissue hypoxia serves as an early upstream initiator for adipose tissue dysfunction by inducing a local state of fibrosis.


Figures

FIG. 1.
FIG. 1.
Angiogenic capacity of white adipose tissue. (A) The top panels show hypoxia staining using the hypoxia probe pimonidazole in wild-type (WT) and ob/ob EWAT. The two bottom panels show the same hypoxia staining of adipocytes (A) located in close proximity to a mammary tumor (T) and another area of the same fat pad located more distal to the tumor. Bar corresponds to 20 μm. (B) Microarray expression analysis of HIF1α in the EWAT, gastrocnemius (Gastroc), and liver of 4-week-old (4w) and 10-week-old (10w) C57/B6 ob/ob and wild-type mice (five mice/group). A.U, arbitrary units. (C) Amount of HIF1α protein binding to the hypoxia response element in the nuclei from the EWAT of 8-week-old ob/ob and wild-type FVB mice (three mice/group). RFU, relative fluorescence units. (D) Immunohistochemical analysis of HIF1α in the EWAT of 8-week-old FVB wild-type and ob/ob mice. The two left panels show an overview of a fat pad, whereas the two right panels show closeup views of the same fat pads. Arrows denote staining close to lipid droplets but not in the inflamed area in between the adipocytes. The black bar represents 200 μm. The red bar represents 25 μm. (E) Microarray expression analysis of VEGFa in EWAT from 4- and 10-week-old C57/B6 ob/ob and wild-type mice in the EWAT, gastrocnemius, and liver (five mice/group). (F) Functional blood vessels in EWAT of 8-week-old ob/ob FVB and wild-type FVB mice visualized by tail vein injection of biotinylated lectin (Griffonia simplicifolia). Blood vessels are shown in red, and DAPI (4′,6-diamidino-2-phenylindole) staining of the nucleus is shown in blue. Quantification of vascular density was determined as percent Cy3 stain per field normalized to the number of adipocytes (three mice/group). Bar equals 50 μm. Panels B, C, E, and F were analyzed by Student's t test. *, P < 0.05.
FIG. 2.
FIG. 2.
Transgenic mouse overexpressing HIF1α in adipose tissue. (A) Quantitative RT-PCR analysis of the aP2 promoter-driven expression of HIF1α-ΔODD shows that the transgene (Tg) expression is very limited in isolated primary macrophages. Within the different fat pads, the transgene expression is heterogeneous, with highest expression in SWAT and lowest in EWAT. (B) Compared to wild-type and ob/ob littermates, the transgene expression results in a significant increase in overall SWAT HIF1α protein binding to the hypoxia response element in HIF1α-ΔODD and HIF1α-ΔODD-ob/ob (two mice/group). RFU, relative fluorescence units. Panels A and B were analyzed by Student's t test. *, P < 0.05.
FIG. 3.
FIG. 3.
Metabolic impact of HIF1α-ΔODD in adipose tissue. Hemizygote transgenic mice (sTg) fed either chow (A) or an HFD (B) have elevated body weight compared to those of their littermates (six mice/group for the chow; nine mice/group for the HFD). WT, wild-type mice. (C) Transgene expression in the ob/ob background does not trigger a further increase in body weight (four mice/group). (D) Quantification of adipocyte size in the H&E staining of adipocytes in wild-type and HIF1α transgenic mice (Tg) after 12 weeks of an HFD. Bar = 100 μm. Five mice/group. (E to G) Circulating glucose levels measured during an OGTT in wild-type and hemizygote HIF1α-ΔODD mice (sTg) fed a chow diet (six mice/group) (E) and in mice fed an HFD for 12 weeks (F) and 5 weeks (G) (seven mice/group). (H) Basal- and insulin-stimulated (1.5 U/kg) changes in the ratio of phosphorylated (Ser473) Akt to total levels of Akt in the livers of wild-type and transgenic mice fed an HFD for 12 weeks. Hallmarks of dysfunctional fat are liver triglyceride accumulation (I), increased levels of F4/80 expression in SWAT, measured by quantitative RT-PCR (J), and increased frequency of crown-like structures (K). The increase in crown-like structures can be observed in HIF1α transgenic mice both fed an HFD for 12 weeks or crossed into the ob/ob background. The immunohistochemical analysis (J) shows the macrophage-specific protein MAC-2 in SWAT. Bar = 200 μm. Seven mice/group for the HFD group; six mice/group for mice in the ob/ob background. Panels A, B, C, E, F, and G were analyzed by a two-way ANOVA for repeated measurements; panels D, H, I, J, and K were analyzed by Student's t test. *, P < 0.05; **, P = 0.07.
FIG. 4.
FIG. 4.
Fibrosis in dysfunctional white adipose tissue. (A) Masson's trichrome staining of SWAT and EWAT from 8-week-old wild-type mice (WT) and ob/ob FVB mice. Fibrillar collagens, primarily collagen I and III, are stained with blue, as indicated with arrowheads. Nuclei are stained with deep purple, whereas keratin stains red. Bar corresponds to 50 μm; three mice/group. (B) Picrosirius red staining of SWAT and EWAT from 8-week-old wild-type and ob/ob FVB mice. Picrosirius red was visualized under polarized light and shows collagen I in orange and collagen 3 in green. (C) LOX expression in the EWAT, gastrocnemius (Gastroc), and liver for wild-type and 10-week-old (10w) ob/ob C57/B6 mice, measured by the microarray analysis (five mice/group). Panel C was analyzed by Student's t test. *, P < 0.05; 4w, 4 week old; A.U, arbitrary units.
FIG. 5.
FIG. 5.
HIF1α-mediated increased fibrosis in adipose tissue. (A) Col1a1, Col3a1, Col6a1, and elastin expression in SWAT from HIF1α-ΔODD mice and wild types (WT) fed an HFD for 12 weeks, as measured by quantitative RT-PCR (five mice/group). sTg, hemizygote transgenic mice; A.U, arbitrary units. (B) Hydroxyproline content in SWAT and EWAT of HIF1α-ΔODD and wild-type littermates fed an HFD for 12 weeks. Values are normalized to the size of the extracellular matrix space per field (six mice/group). (C) SWAT content of LOX mRNA levels in wild-type, hemizygote, and homozygote transgenic mice (dTg) after 5 weeks of an HFD, as measured by quantitative RT-PCR (five mice/group). (D) Protein levels of both the 50-kDa prepeptide and the 30-kDa active form of LOX in the SWAT of HIF1α-ΔODD and wild-type littermates fed an HFD for 12 weeks, as measured by Western blot analysis. Results were normalized to those of GDI (four mice/group). Tg, transgenic mice. (E) Quantification of the size of the trichrome-laden streaks through the adipose tissue in the SWAT from HIF1α-ΔODD mice versus wild types after 5 weeks of an HFD. Trichrome staining stains collagen fibers in blue, keratin in red, and nuclei in purple. The blue collagen fibers were quantified by measuring the blue area using ImageJ. Bar corresponds to 25 μm. (F) Picrosirius red staining of SWAT from HIF1α-ΔODD mice versus wild types after 5 weeks of an HFD, showing collagen I in orange and collagen III in green. Bar corresponds to 50 μm. (G) Quantification of the trichrome-stained streaks of SWAT of 18-week-old ob/ob and HIF1α-ΔODD-ob/ob mice. Bar corresponds to 25 μm. (H) Picrosirius red staining of SWAT from 18-week-old HIF1α-ΔODD and HIF1α-ΔODD-ob/ob mice. Bar corresponds to 50 μm. Five mice/group for the HFD group and four mice/group for the ob/ob group. Panels A, B, C, D, E, and G were analyzed by Student's t test. *, P < 0.05.
FIG. 6.
FIG. 6.
Inhibition of LOX by BAPN treatment leads to an improved metabolic phenotype. (A) Circulating glucose during OGTT of HIF1α-ΔODD mice treated with either vehicle or the LOX inhibitor BAPN for the last 2 weeks of a 5-week HFD experiment (four mice/group). Tg, transgenic mice. (B) Quantification of the collagen-loaded streaks using ImageJ in the SWAT of HIF1α-ΔODD mice treated with either vehicle or the LOX inhibitor BAPN. Bar corresponds to 25 μm (four mice/group). (C) SWAT expression of F4/80 (Emr1) in HIF1α-ΔODD treated with either vehicle or the LOX inhibitor BAPN for the last 2 weeks of a 5-week HFD, as measured by quantitative RT-PCR (four mice/group). A.U, arbitrary units. (D) Schematic illustration of the inverse overlap between the microarray analysis of HIF transgenic versus wild-type mice, with HIF transgenic mice treated with either vehicle or the LOX inhibitor BAPN. Specifically, four important gene clusters are shown, as follows: extracellular matrix, inflammation, blood vessel development, and lymphocyte activation. Shown in the red circle is the number of genes changed by the HIF transgene compared to that of wild-type mice. The black circle, on the other hand, contains the number of genes that were altered by the LOX inhibitor BAPN in the HIF transgenic mice. Underneath each cluster are examples of inversely regulated genes. Panel A is analyzed by the two-way ANOVA for repeated measures; panels B and C are analyzed by Student's t test. *, P < 0.05.
FIG. 7.
FIG. 7.
Refined HFD time course. (A) Body weight of wild-type mice fed an HFD for 20 days. (B) Adipocyte area of the SWAT compartment during 20 days of an HFD in wild-type mice. (C to H) mRNA levels of HIF1α, LOX, Col1a1, Col3a1, F4/80, and TNF-α in the SWAT of wild-type mice fed an HFD for 20 days. A.U, arbitrary units. (I) Detection of crown-like structures (indicated by arrowheads) by immunoreactive MAC-2 in SWAT before and during 20 days of an HFD. (A to I) Three mice/time point. CLS, crownlike structure. Data were analyzed by the Student's t test. *, P < 0.05.
FIG. 8.
FIG. 8.
Respiratory hypoxia. Expression levels of LOX, Col1a1, Col3a1, GLUT1, F4/80, and VEGFa in the SWAT (A) and muscle (B) in mice breathing ambient air or 10% O2 for 48 h and 10% O2 for 5 days, as measured by quantitative RT-PCR. All data were analyzed by Student's t test, with four mice/group. *, P < 0.05; A.U, arbitrary units.
FIG. 9.
FIG. 9.
Schematic representation of the suggested hypothesis. During periods of a positive-energy balance, white adipose tissue expands to meet the need for extra triglyceride storage. As a consequence, adipose tissue becomes hypoxic, thereby activating the transcription factor HIF1α. HIF1α in turn activates a host of genes involved in several physiological responses. Here, we demonstrate that this HIF1α activation initiates a fibrotic response and causes insulin resistance in white adipose tissue. Furthermore, we show that HIF1 induces the collagen cross-linker LOX, which plays a crucial part in this process. Finally, we hypothesize that HIF1-induced fibrosis can be the initiating factor for monocyte infiltration and inflammation.

References

    1. Brahimi-Horn, M. C., J. Chiche, and J. Pouyssegur. 2007. Hypoxia and cancer. J. Mol. Med. 851301-1307. - PubMed
    1. Brakenhielm, E., R. Cao, B. Gao, B. Angelin, B. Cannon, P. Parini, and Y. Cao. 2004. Angiogenesis inhibitor, TNP-470, prevents diet-induced and genetic obesity in mice. Circ. Res. 941579-1588. - PubMed
    1. Cancello, R., C. Henegar, N. Viguerie, S. Taleb, C. Poitou, C. Rouault, M. Coupaye, V. Pelloux, D. Hugol, J. L. Bouillot, A. Bouloumie, G. Barbatelli, S. Cinti, P. A. Svensson, G. S. Barsh, J. D. Zucker, A. Basdevant, D. Langin, and K. Clement. 2005. Reduction of macrophage infiltration and chemoattractant gene expression changes in white adipose tissue of morbidly obese subjects after surgery-induced weight loss. Diabetes 542277-2286. - PubMed
    1. Cho, C. H., Y. J. Koh, J. Han, H. K. Sung, H. Jong Lee, T. Morisada, R. A. Schwendener, R. A. Brekken, G. Kang, Y. Oike, T. S. Choi, T. Suda, O. J. Yoo, and G. Y. Koh. 2007. Angiogenic role of LYVE-1-positive macrophages in adipose tissue. Circ. Res. 100e47-e57. - PubMed
    1. Chun, T. H., K. B. Hotary, F. Sabeh, A. R. Saltiel, E. D. Allen, and S. J. Weiss. 2006. A pericellular collagenase directs the 3-dimensional development of white adipose tissue. Cell 125577-591. - PubMed

Publication types

MeSH terms

LinkOut - more resources