. 2009 Jun 29;185(7):1259-73.
doi: 10.1083/jcb.200903053. Epub 2009 Jun 22.

MURC/Cavin-4 and cavin family members form tissue-specific caveolar complexes

Affiliations

MURC/Cavin-4 and cavin family members form tissue-specific caveolar complexes

Michele Bastiani et al. J Cell Biol. .

Abstract

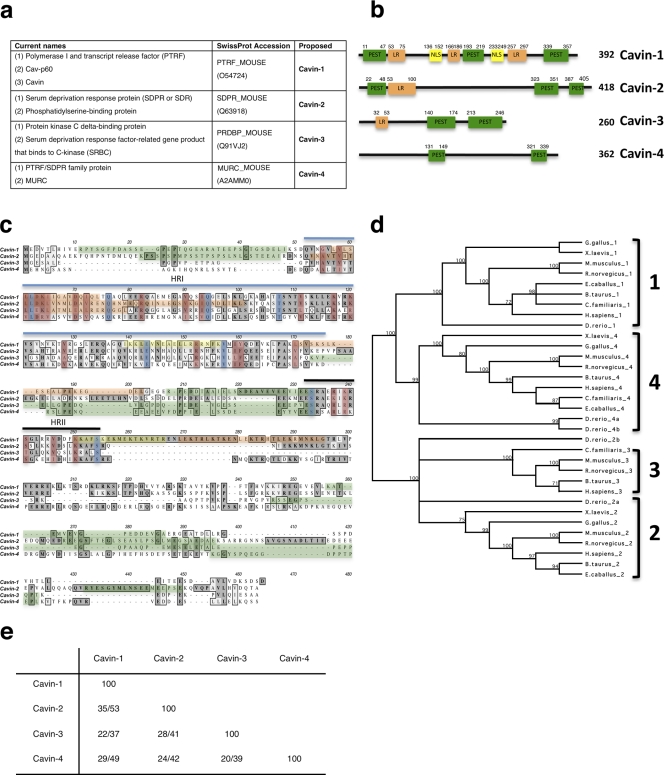
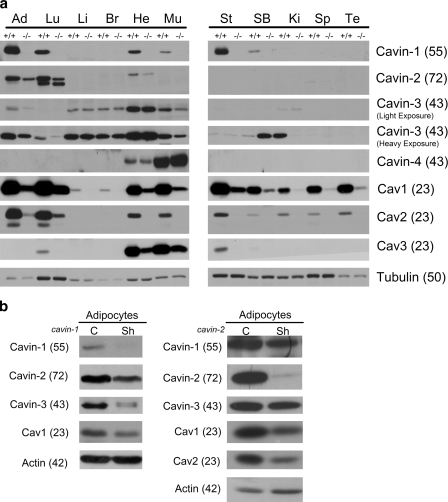
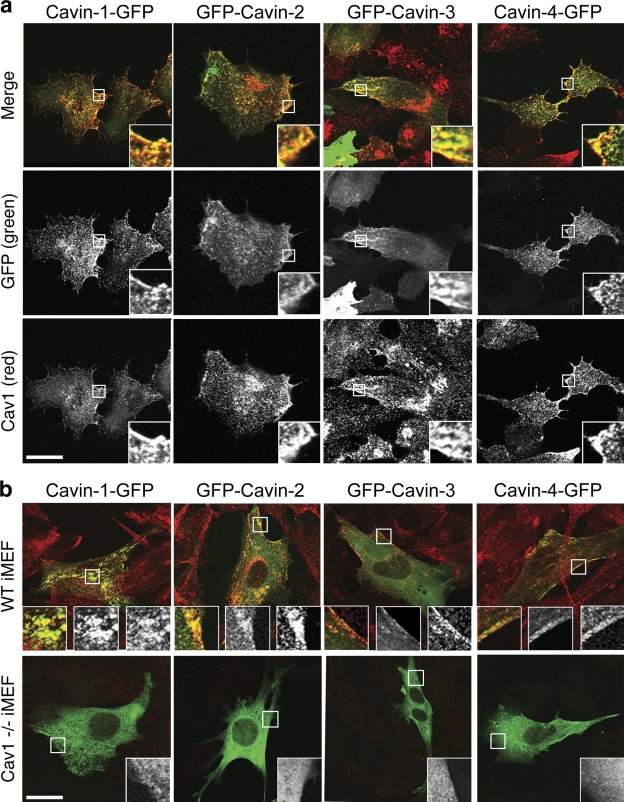
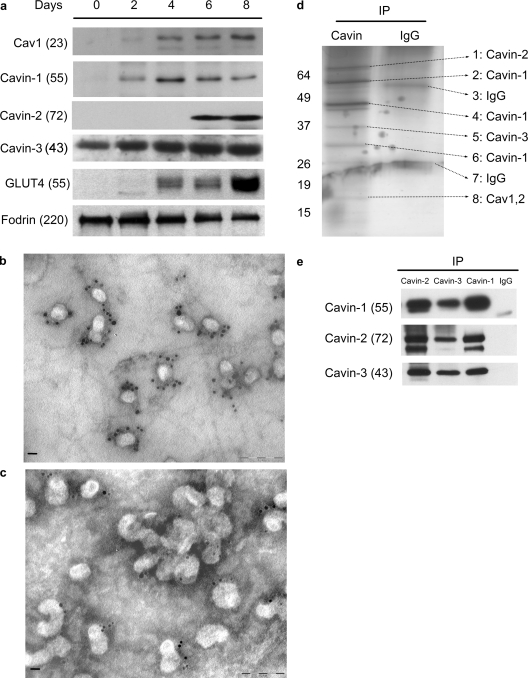
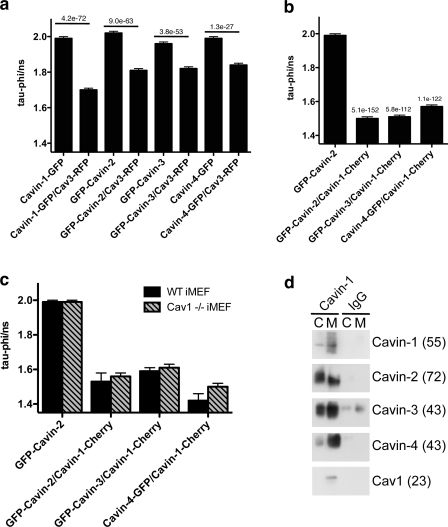
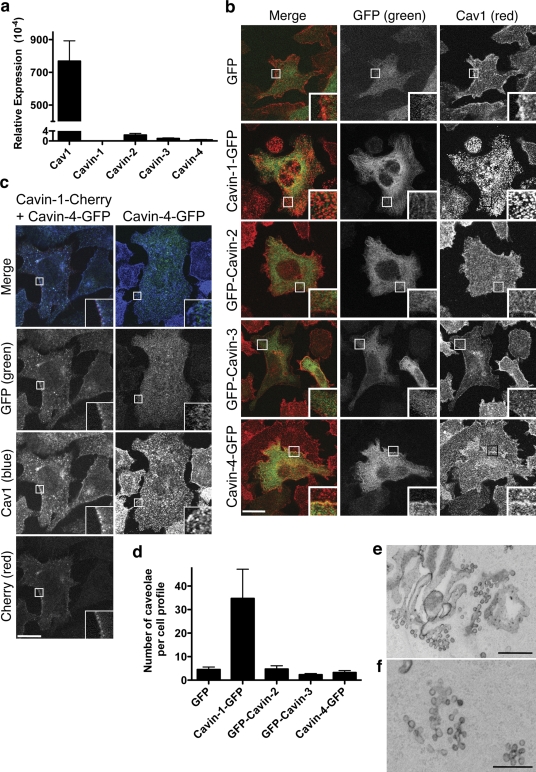
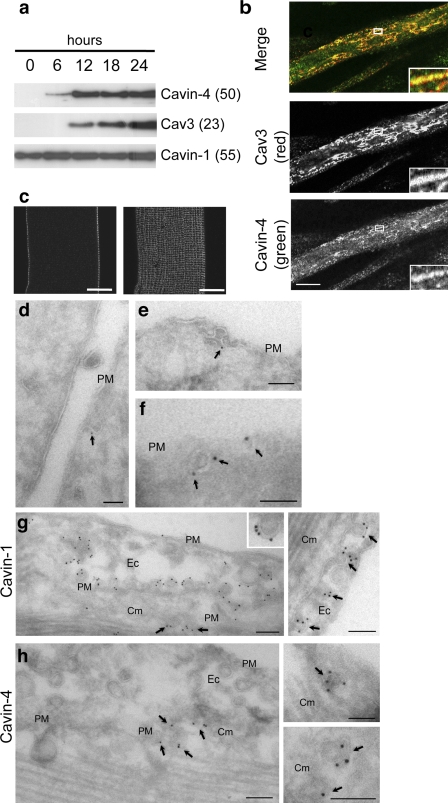
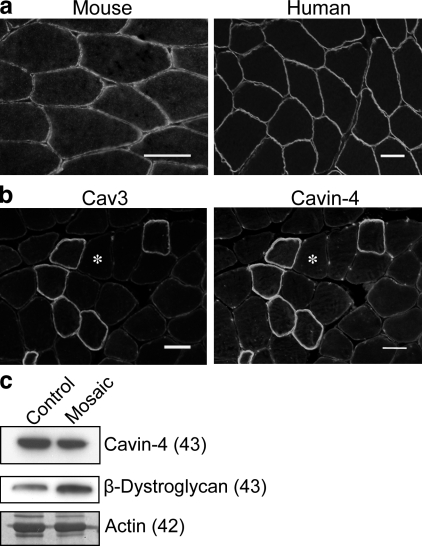
Polymerase I and transcript release factor (PTRF)/Cavin is a cytoplasmic protein whose expression is obligatory for caveola formation. Using biochemistry and fluorescence resonance energy transfer-based approaches, we now show that a family of related proteins, PTRF/Cavin-1, serum deprivation response (SDR)/Cavin-2, SDR-related gene product that binds to C kinase (SRBC)/Cavin-3, and muscle-restricted coiled-coil protein (MURC)/Cavin-4, forms a multiprotein complex that associates with caveolae. This complex can constitutively assemble in the cytosol and associate with caveolin at plasma membrane caveolae. Cavin-1, but not other cavins, can induce caveola formation in a heterologous system and is required for the recruitment of the cavin complex to caveolae. The tissue-restricted expression of cavins suggests that caveolae may perform tissue-specific functions regulated by the composition of the cavin complex. Cavin-4 is expressed predominantly in muscle, and its distribution is perturbed in human muscle disease associated with Caveolin-3 dysfunction, identifying Cavin-4 as a novel muscle disease candidate caveolar protein.


Figures

Figure 1.
Figure 1.
The PTRF/Cavin family member proteins. (a) Summary of the names used in this paper. (b) Domain structure of cavin proteins in mouse. Putative PEST domains (green), leucine-rich regions (LR; orange), and nuclear localization sequences (NLS; yellow) are shown with amino acid numbers indicated. (c) Amino acid alignment of murine cavin proteins. Dark gray denotes identity, whereas light gray denotes similarity. Proposed cavin homology regions (HR) are marked with lines. Blue indicates identical amino acids, and red indicates conserved amino acids in evolution across all family members. Green, orange, and yellow are as indicated in b. (d) Midpoint-rooted tree showing several species containing cavin family members. Numbers represent the percentage of 1,000 bootstrap trials that supports the branch (numbers <70% are not depicted). (e) Percentage identity/similarity of murine cavin proteins.
Figure 2.
Figure 2.
Cavin family members are down-regulated in cavin-1 knockout mice. (a) Tissue lysates from WT (+/+) and cavin-1 knockout mice (−/−) from the indicated tissues were prepared in RIPA buffer. Heavy and light exposures of Cavin-3 are shown to best demonstrate its distribution. Equal protein amounts were subjected to SDS-PAGE and immunoblotted with the indicated antibodies. Ad, adipose tissue; Lu, lung; Li, liver; Br, brain; He, heart; Mu, skeletal muscle; St, stomach; SB, small bowel; Ki, kidney; Sp, spleen; Te, testis. (b) Cavin-1 to -3, Cav1, and Cav2 are down-regulated in shRNA (Sh) knockdown 3T3-L1 adipocytes. Whole cell lysates from Cavin-1–shRNA (Liu and Pilch, 2008) or Cavin-2–shRNA knockdown adipocytes were analyzed by Western blotting with the indicated antibodies. C, control. Molecular masses (in parentheses) are given in kilodaltons.
Figure 3.
Figure 3.
Cavins colocalize with caveolin and are dependent on caveolin for surface localization. (a) BHK cells transfected with GFP-tagged Cavin-1, -2, -3, or -4 (green) were PFA fixed and immunolabeled for endogenous Cav1 (red). Cavin family members and Cav1 extensively colocalized in a pattern consistent with caveolae distribution. Insets show enlargements of the selected areas. (b) WT and Cav1−/− iMEFs were transfected with GFP-tagged cavins (green) and labeled for endogenous Cav1 (red). In WT iMEFs, cavins colocalized with Cav1 on the plasma membrane. In Cav1−/− iMEFs, cavin proteins were mainly restricted to the cytosol, although in a small proportion of highly expressing cells, a surface pool of protein could be detected. Insets represent (from left to right) an enlargement of the selected area showing the merged image, GFP (green), and Cav1 (red). Bars, 10 µm.
Figure 4.
Figure 4.
Cavin-1 to -3 forms a complex at caveolae in adipocytes. (a) Cavin-1 to -3 and Cav1 are induced during 3T3-L1 adipocyte differentiation (note that Cavin-4 is not normally expressed in adipocytes). Total cell lysates were prepared from 3T3-L1 cells on the indicated day after induction of differentiation. Equal amounts of protein were analyzed by immunoblotting. Fodrin is shown as loading control. (b and c) Electron micrographs show a view of the cytoplasmic face of the adipocyte plasma membrane immunogold labeled for Cavin-2 (b) and Cavin-3 (c). The presence of Cavin-2 and -3 are primarily exclusively in or very near to clustered or single caveolar structures in multiple copies. Bars, 100 nm. (d) Cavin-1 to -3 forms a complex. 100 µg plasma membrane from primary adipocytes was solubilized in lysis buffer and immunoprecipitated with 3 µg anti–Cavin-1 or nonspecific IgG. The bound proteins were subjected to SDS-PAGE, silver stained as shown, and bands were identified as the indicated proteins (arrows) by mass spectrometry. (e) Similar immunoprecipitations were performed using anti–Cavin-1, -2, or -3 antibodies or nonspecific IgG. After SDS-PAGE, the bound proteins were analyzed by immunoblotting. IP, immunoprecipitation. Molecular masses (in parentheses) and markers are indicated in kilodaltons.
Figure 5.
Figure 5.
Cavin proteins form a multimeric complex and interact with caveolin. (a and b) BHK cells transiently expressing GFP-tagged cavin family members with or without Cav3-RFP (a) or expressing different combinations of fluorescently tagged cavin proteins (b) were analyzed using FLIM/FRET as detailed previously in Hill et al. (2008). In c, WT or Cav1−/− iMEFs expressing tagged cavin family members were analyzed by FLIM/FRET. Data represent mean GFP fluorescence lifetime ± SEM. All of the family members presented a significant reduction in GFP lifetime when coexpressed with Cav3-RFP (a) and Cavin-1–Cherry (b and c), indicating that these proteins are in close proximity. P-values of Student's t test are indicated; n = 80–150 cells. (d) Cavin-1–binding proteins were isolated from equivalent volumes of cytosol (C) and membrane (M) fractions prepared from WT iMEFs using Cavin-1 antibody or normal rabbit IgG as control. Binding to Cavin-2, -3, and -4 was observed in both cytosol and membrane fractions, whereas caveolin binding was only detected in the membrane fraction. Longer exposure of starting material detected cavin bands of corresponding sizes (not depicted). Result is representative of three independent experiments. Molecular masses (in parentheses) are indicated in kilodaltons.
Figure 6.
Figure 6.
Cavin-1, but not other cavins, generates caveolae in a heterologous system. (a) Relative expression of cavins and Cav1 mRNA in comparison with 18S RNA in PC3 cells was measured by RT-PCR. The y axis was divided to compare the cavins and Cav1 expression in the same scale. (b) PC3 cells stably expressing GFP-tagged cavins (green) were FACs sorted, methanol fixed, and immunolabeled for endogenous Cav1 (red). Only Cavin-1 caused Cav1 redistribution from a diffuse surface pattern to puncta consistent with caveolae formation (Hill et al., 2008). (c) PC3 cells transiently transfected with Cavin-4–GFP (green) alone or in combination with Cavin-1–Cherry (red) were methanol fixed and immunolabeled for endogenous Cav1 (blue). In cells expressing Cavin-4 plus Cavin-1, Cavin-4 colocalizes with Cav1 and Cavin-1 at the plasma membrane. Insets show a magnified view of the selected areas. (d) Quantitation of caveolae in stably transfected PC3 cell lines by EM expressed as mean ± SEM per cell. Caveolae were defined morphologically as plasma membrane (i.e., ruthenium red positive) pits/vesicular profiles of a diameter <100 nm. The number of such structures over the entire surface of at least 10 cell profiles per condition was determined and expressed as mean ± SEM per cell. Similar results were obtained in two independent experiments. (e and f) Representative micrograph of caveolae in PC3 cells stably expressing Cavin-1. Bars: (b) 10 µm; (e) 500 nm; (f) 200 nm.
Figure 7.
Figure 7.
Immunogold electron microscopic localization of endogenous Cavin-4 in C2C12 cells. (a) Expression of Cavin-1, -4, and Cav3 during C2C12 myotubes differentiation. Protein expression was analyzed by Western blotting at selected intervals after the initiation of differentiation. On longer exposures, low levels of Cavin-4 were also detected in myoblasts. Note that although in cardiac and skeletal muscle preparations Cavin-4 consistently migrates at 43 kD, in C2C12 myotubes, a major band is detected around 50 kD, possibly indicating a posttranslational modification in this cell type. (b) Myotubes (4 d) were methanol fixed, labeled for endogenous Cavin-4 (green) and Cav3 (red), and the top surface of the myotube was imaged using a confocal microscope. Insets show a magnified view of the selected areas. (c) Isolated muscle fibers were immunolabeled with anti–Cavin-4 antibody and analyzed by high resolution light microscopic analysis. Cavin-4 labeling was observed over the sarcolemma of the muscle with very low intracellular labeling. (d–f) C2C12 myotubes were immunolabeled for Cavin-4 using affinity-purified antibodies followed by 10 nm protein A gold. Specific labeling is associated with pits and vesicular profiles close to the plasma membrane (PM) with the typical morphology of caveolae. Arrows indicate gold particles labeling Cavin-4 at the plasma membrane. (g and h) Immuno-EM localization of Cavin-1 (g) and -4 (h) in cardiac muscle. A gallery of images showing regions of cardiac tissue containing both endothelial cells (Ec) and cardiac muscle (Cm). Cavin-1 is associated with caveolae of both endothelial cells and cardiac muscle (left, arrows). Note the high density of labeling associated with the cytoplasmic face of the caveolae (right, arrows). Cavin-4 is not detectable on endothelial caveolae but associates with vesicular profiles with caveolar morphology in cardiac muscle (arrows). Molecular masses (in parentheses) are indicated in kilodaltons. Bars: (b and c) 20 µm; (d–h) 100 nm.
Figure 8.
Figure 8.
Cavin-4 localization is perturbed in muscle disease. (a) Cryosections from mouse and human skeletal muscle were immunolabeled for Cavin-4, showing localization to sarcolemmal membrane. (b) Immunolabeling of Cav3 in a patient with rippling muscle disease (Cav3 mosaic) reveals markedly reduced Cav3 and Cavin-4 staining in a subpopulation of muscle fibers (indicated by asterisks). (c) Cavin-4 expression was reduced in muscle from Cav3 mosaic samples in comparison with control tissue. 10 µg muscle lysate was loaded. β-Dystroglycan expression and coomassie staining of actin demonstrate relative loading of muscle protein. Molecular masses (in parentheses) are indicated in kilodaltons. Bars, 50 µm.

References

    1. Aboulaich N., Vainonen J.P., Stralfors P., Vener A.V. 2004. Vectorial proteomics reveal targeting, phosphorylation and specific fragmentation of polymerase I and transcript release factor (PTRF) at the surface of caveolae in human adipocytes.Biochem. J. 383:237–248 - PMC - PubMed
    1. Birnbaum M.J. 1989. Identification of a novel gene encoding an insulin-responsive glucose transporter protein.Cell. 57:305–315 - PubMed
    1. Burgener R., Wolf M., Ganz T., Baggiolini M. 1990. Purification and characterization of a major phosphatidylserine-binding phosphoprotein from human platelets.Biochem. J. 269:729–734 - PMC - PubMed
    1. Capozza F., Combs T.P., Cohen A.W., Cho Y.R., Park S.Y., Schubert W., Williams T.M., Brasaemle D.L., Jelicks L.A., Scherer P.E., et al. 2005. Caveolin-3 knockout mice show increased adiposity and whole body insulin resistance, with ligand-induced insulin receptor instability in skeletal muscle.Am. J. Physiol. Cell Physiol. 288:C1317–C1331 - PubMed
    1. Carlton J.G., Cullen P.J. 2005. Coincidence detection in phosphoinositide signaling.Trends Cell Biol. 15:540–547 - PMC - PubMed

Publication types

MeSH terms