. 2009 Jun 29;185(7):1243-58.
doi: 10.1083/jcb.200809044. Epub 2009 Jun 22.

Desmoglein 1-dependent suppression of EGFR signaling promotes epidermal differentiation and morphogenesis

Affiliations

Desmoglein 1-dependent suppression of EGFR signaling promotes epidermal differentiation and morphogenesis

Spiro Getsios et al. J Cell Biol. .

Abstract

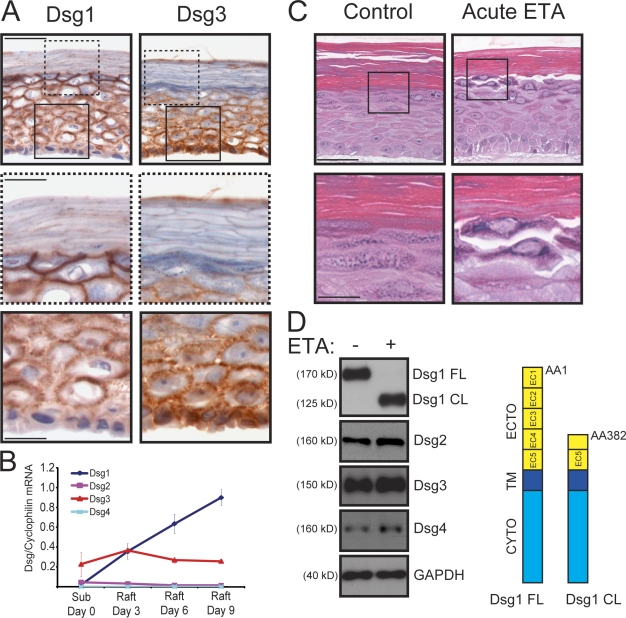
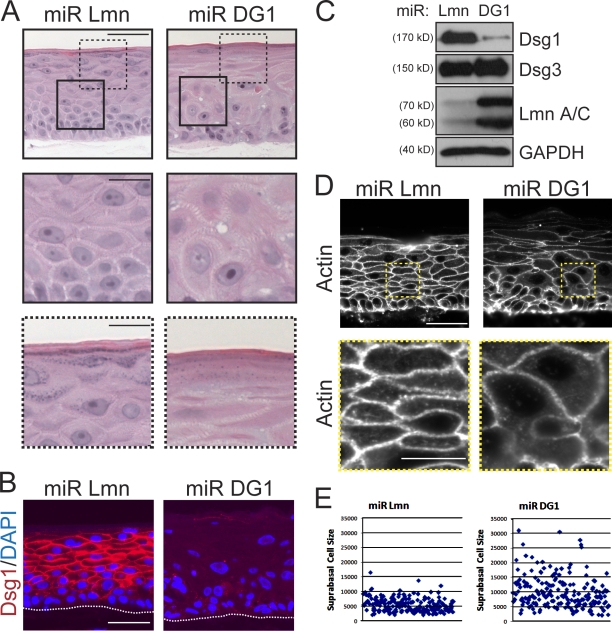
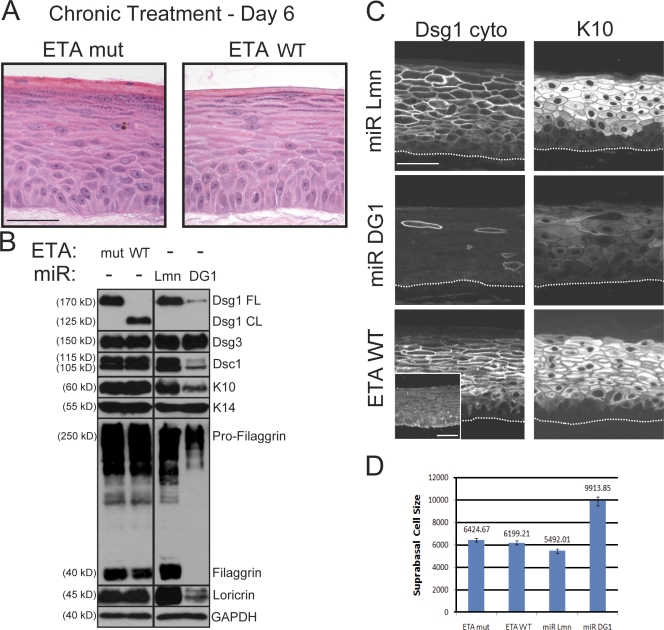
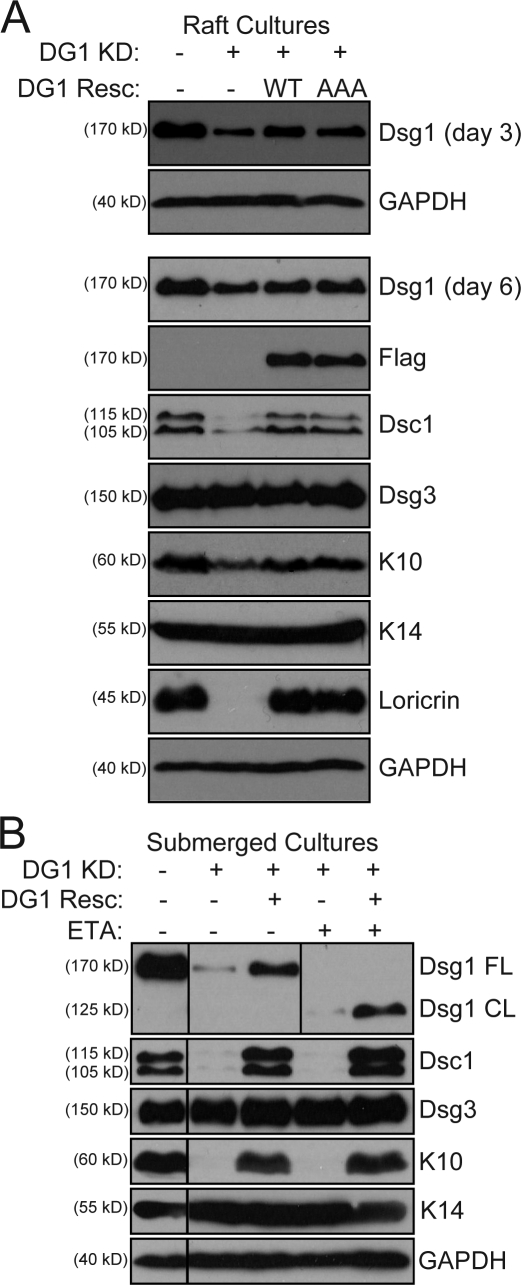
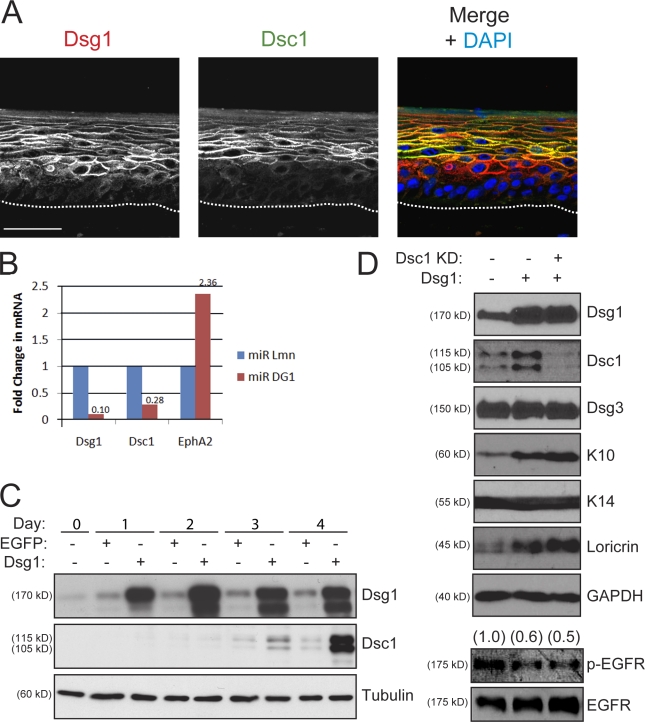
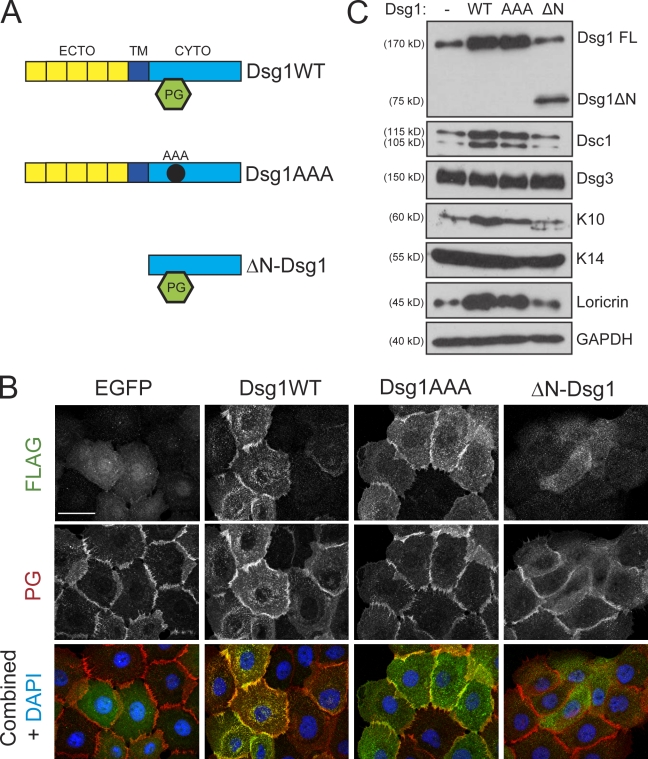
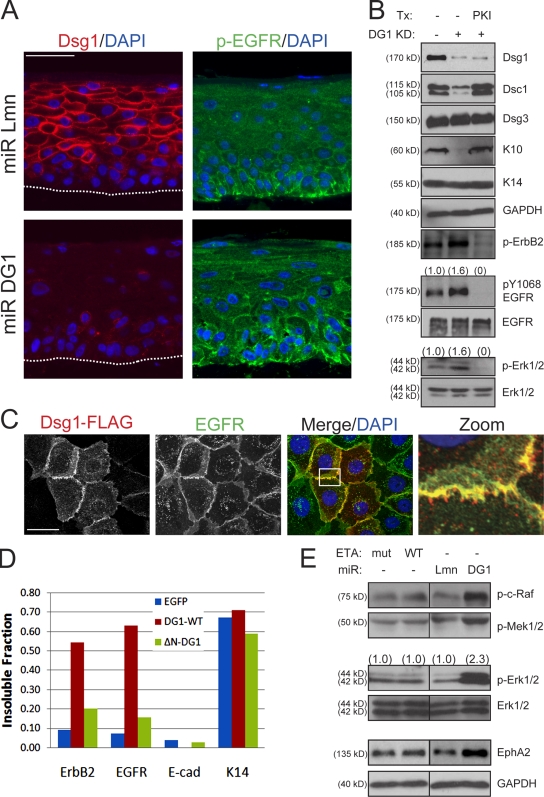
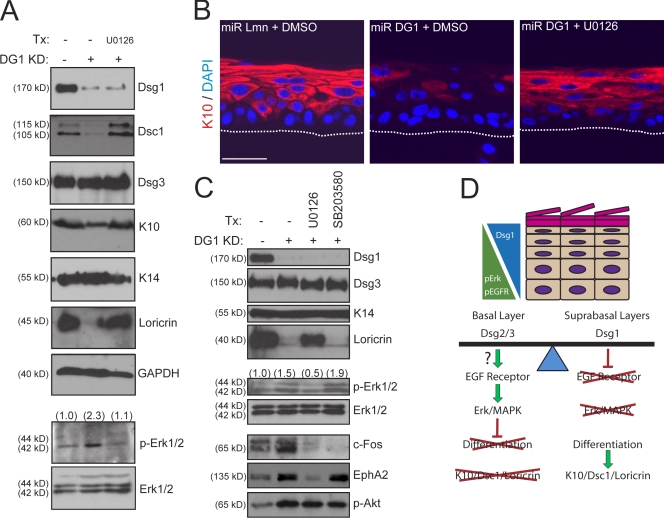
Dsg1 (desmoglein 1) is a member of the cadherin family of Ca(2+)-dependent cell adhesion molecules that is first expressed in the epidermis as keratinocytes transit out of the basal layer and becomes concentrated in the uppermost cell layers of this stratified epithelium. In this study, we show that Dsg1 is not only required for maintaining epidermal tissue integrity in the superficial layers but also supports keratinocyte differentiation and suprabasal morphogenesis. Dsg1 lacking N-terminal ectodomain residues required for adhesion remained capable of promoting keratinocyte differentiation. Moreover, this capability did not depend on cytodomain interactions with the armadillo protein plakoglobin or coexpression of its companion suprabasal cadherin, Dsc1 (desmocollin 1). Instead, Dsg1 was required for suppression of epidermal growth factor receptor-Erk1/2 (extracellular signal-regulated kinase 1/2) signaling, thereby facilitating keratinocyte progression through a terminal differentiation program. In addition to serving as a rigid anchor between adjacent cells, this study implicates desmosomal cadherins as key components of a signaling axis governing epithelial morphogenesis.


Figures

Figure 1.
Figure 1.
Differentiation-dependent Dsg1 maintains adhesion in the superficial layers of epidermal raft cultures. (A) IHC analysis of Dsg1 and Dsg3 in frozen sections prepared from 9-d-old rafts. Dsg1 was concentrated in the suprabasal layers (insets with dashed lines), whereas Dsg3 was prominent in the basal layer (insets with continuous lines). (B) Real-time PCR analysis of Dsg1–4 mRNA levels from keratinocytes maintained as submerged cultures (Sub day 0) or on rafts for 3, 6, or 9 d. The Dsg mRNA levels were normalized to cyclophilin 1 levels interpolated from a standard curve, and the mean of three independent experiments (±SEM) is represented in the graph. Dsg1 mRNA levels were tightly coordinated with raft maturation, whereas Dsg3 remained relatively constant. Maximal Dsg2 (0.0468 ± 0.0318) and Dsg4 (0.000874 ± 0.000101) mRNA transcript levels were detected in submerged and day 9 raft cultures, respectively. (C) H&E-stained sections of 9-d-old rafts incubated with or without 5 µg/ml recombinant ETA (acute ETA) for 24 h. Boxed insets show areas of cell–cell dissociation in the uppermost layers of ETA-treated rafts, whereas control cultures remained intact. (D) Western blot analysis of these raft cultures using a cytoplasmic domain (CYTO) antibody for Dsg1 demonstrated that the N-terminal portion (aa 1–381) of the adhesive ectodomain (ECTO) of the full-length protein (Dsg1 FL) was efficiently cleaved in the presence of ETA, resulting in a membrane-associated cytoplasmic fragment (Dsg1 CL; aa 382–1,049) that was retained in whole cell lysates. Dsg2–4 were not cleaved by ETA. GAPDH, glyceraldehyde-3-phosphate dehydrogenase; TM, transmembrane domain. Bars: (A and C) 50 µm; (insets) 20 µm.
Figure 2.
Figure 2.
Dsg1 deficiency impairs morphogenesis of epidermal raft cultures. (A) H&E-stained sections of 6-d-old rafts expressing miR Lmn or miR DG1. Dsg1-deficient rafts exhibited abnormal suprabasal morphology (insets with continuous lines) and a poorly differentiated appearance (insets with dashed lines) compared with controls. (B) IHC analysis of Dsg1 in miR Lmn or miR DG1 rafts revealed a profound loss of Dsg1 at 6 d. The keratinocyte–collagen interface is highlighted by the dotted line. (C) Western blot analysis of Dsg1, Dsg3, lamin A/C (Lmn A/C), and GAPDH (glyceraldehyde-3-phosphate dehydrogenase) from these raft cultures indicated that Dsg1 or lamin A/C levels were reduced by ∼90%. (D) An actin antibody was used to highlight the cellular cortex in Dsg1-deficient cultures and generate surface area measurements of individual suprabasal cells using indirect immunofluorescence staining. Although control cultures exhibited compact, uniformly shaped suprabasal cells, cultures lacking Dsg1 possessed suprabasal cells that displayed a highly irregular array of individual cell sizes. Boxed insets highlight suprabasal cell morphology between miR Lmn and miR DG1 rafts. (E) The surface area from individual suprabasal cells (n > 150) from miR Lmn or miR DG1 rafts was measured using MetaMorph software, and individual data points from a representative experiment are shown in the scatter plot. Bars: (A, B, and D) 50 µm; (insets) 20 µm.
Figure 3.
Figure 3.
N-terminal ectodomain residues of Dsg1 required for adhesion are not essential for epidermal raft development. (A) H&E analysis of raft cultures treated with WT ETA (ETA WT) or a protease-dead mutant (ETA mut) and maintained at an air–liquid interface for an additional 6 d. Chronic Dsg1 EC1–3 cleavage did not grossly alter suprabasal morphogenesis. (B) Western blot analysis revealed a reduction in Dsc1, K10, filaggrin, and loricrin in raft cultures deficient in Dsg1 (miR DG1) compared with miR Lmn controls. In contrast, there were no differences in the levels of these suprabasal proteins in rafts treated with ETA WT or mut. Levels of Dsg3 and the basal marker K14 were equivalent in all conditions. Black lines indicate that intervening lanes have been spliced out. CL, cleaved; FL, full length; GAPDH, glyceraldehyde-3-phosphate dehydrogenase. (C) IHC staining confirmed that both K10 and Dsc1 (Figs. S1 and S4) were reduced in Dsg1-silenced cultures (miR DG1), whereas control (miR Lmn) and ETA-treated (ETA WT) cultures robustly expressed these suprabasal markers. Also, note that ETA-treated cultures retained a cleaved fragment (aa 382–1,049) of Dsg1 at intercellular borders, as revealed by staining with an antibody against the cytoplasmic domain of Dsg1 (Dsg1 cyto), whereas the extracellular epitope (aa 1–381) was effectively removed by ETA (inset). The dotted lines indicate the boundary between keratinocytes and the collagen matrix. (D) The mean surface area (±SEM) of individual suprabasal cells from ETA-treated or Dsg1 knockdown rafts was determined using actin immunostaining to outline the cell cortex. Although control and ETA-treated cultures exhibited suprabasal cells of similar size, cultures lacking Dsg1 possessed suprabasal cells that were nearly twice as large. Bars, 50 µm.
Figure 4.
Figure 4.
Reconstitution of Dsg1 restores epidermal differentiation despite ectodomain cleavage. (A) Western blot analysis of keratinocytes cotransduced with miR Lmn or miR DG1 (DG1 KD) and either EGFP (DG1 Resc −) or silencing refractory WT or PG-binding mutant (AAA) Dsg1 constructs and then grown as raft cultures. Although Dsg1 was more efficiently silenced at day 3 (top), modest silencing was still evident at day 6 (bottom) with concomitant reduction of differentiation markers. Cotransduction with either miR-resistant Dsg1 WT or Dsg1 AAA was sufficient to increase Dsg1 levels and restore Dsc1/K10/loricrin levels to that of controls. (B) Similar rescue experiments were performed in submerged culture in which Dsg1 silencing was more efficient. Silencing of Dsg1 (DG1 KD) resulted in a decrease in Dsc1/K10 levels, and this deficiency was rescued by the silencing-resistant Dsg1 (DG1 Resc +; third lane) but not a susceptible WT Dsg1 construct (DG1 Resc −; second lane). Moreover, chronic treatment with ETA efficiently cleaved the N-terminal portion of the adhesive ectodomain of the Dsg1 rescue construct but did not affect its ability to rescue differentiation in Dsg1-silenced keratinocytes (fifth lane). Black lines indicate that intervening lanes have been spliced out. CL, cleaved; FL, full length; GAPDH, glyceraldehyde-3-phosphate dehydrogenase.
Figure 5.
Figure 5.
Dsg1 promotes keratinocyte differentiation in a manner that does not rely on its regulation of Dsc1 expression. (A) Dual-label IHC staining revealed that Dsg1 (red) is expressed in lower cellular layers of day 6 rafts compared with Dsc1 (green). A merged overlay image containing DAPI (blue) as a nuclear stain is mounted to the right. The dotted lines indicate the boundary between keratinocytes and the collagen matrix. (B) Real-time PCR analysis showed that Dsc1 mRNA levels are reduced in Dsg1 knockdown rafts. The mRNA levels of Dsg1, Dsc1, and a gene target of EGFR, EphA2, were normalized to 18-S ribosomal RNA using the comparative CT method. The data are representative of four independent experiments and are shown as fold change from miR Lmn controls. (C) Ectopic Dsg1-Flag in keratinocytes maintained in low (0.2 mM) Ca2+ to limit differentiation results in a time-dependent increase in Dsc1 expression compared with EGFP-transduced controls. Protein lysates from 0 to 4 d after retroviral transduction were analyzed using an antibody specific for Dsg1 (ectopic + endogenous), Dsc1, or tubulin as a loading control. (D) Dsg1-Flag was ectopically expressed in keratinocytes and additionally transfected with a pool of Dsc1 siRNA or control oligonucleotides (75 nM total) for 48 h in low Ca2+. Confluent cultures were switched into high (1.8 mM) Ca2+ to initiate differentiation and harvested after 24 h. Ectopic Dsg1 was capable of increasing the levels of differentiation-associated proteins, whereas the levels of p-EGFR were reduced. Dsc1 knockdown (KD) did not interfere with the Dsg1-dependent changes in K10, loricrin, or p-EGFR. Ratios of p-EGFR to total EGFR are indicated above the blots. GAPDH, glyceraldehyde-3-phosphate dehydrogenase. Bar, 50 µm.
Figure 6.
Figure 6.
Dsg1 promotes differentiation in the absence of robust PG binding. (A) To test which domains of Dsg1 would be sufficient to drive differentiation, we generated three Flag-tagged Dsg1 cDNA constructs: WT Dsg1 (Dsg1WT), a triple point mutant harboring three Ala substitutions (Dsg1AAA) within the predicted binding region for PG, or a truncation mutant lacking the ectodomain (ECTO) and transmembrane (TM) region (ΔN-Dsg1). CYTO, cytoplasmic domain. (B) The subcellular localization of Dsg1WT, Dsg1AAA, or ΔN-Dsg1 was determined in keratinocytes immunostained using a rabbit polyclonal antibody directed against Flag and a chicken polyclonal antibody against PG after exposing cells to high Ca2+ for 4 h to induce junction assembly. Both Dsg1WT and Dsg1AAA were efficiently recruited to areas of cell–cell contact; however, ΔN-Dsg1 was diffusely distributed throughout the cytoplasm. PG staining highlighted the intercellular borders; its localization at junctions was largely unaffected by any of the Dsg1 constructs. (C) Western blot analysis of keratinocytes transduced with these Dsg1 constructs and induced to differentiate for 2 d as submerged cultures. Although Dsg1WT and Dsg1AAA were sufficient to increase Dsc1/K10/loricrin, ΔN-Dsg1 did not affect these markers of differentiation compared with EGFP-transduced (Dsg1−) control cultures. FL, full length; GAPDH, glyceraldehyde-3-phosphate dehydrogenase. Bar, 20 µm.
Figure 7.
Figure 7.
Dsg1 is required for the suppression of EGFR–Erk1/2 signaling during epidermal differentiation. (A) IHC analysis of Dsg1 (left) and EGFR phosphorylated at Y1068 (p-EGFR; right) revealed a basally restricted p-EGFR staining pattern largely absent from Dsg1-positive suprabasal layers in control (miR Lmn) cultures, whereas Dsg1-deficient cultures (miR DG1) demonstrated a gross disorganization of p-EGFR, which was present throughout the basal and suprabasal layers. The dotted lines indicate the boundary between keratinocytes and the collagen matrix. (B) Western blot analysis of keratinocytes transduced with miR Lmn or miR DG1 and induced to undergo differentiation for 2 d as submerged cultures in the presence or absence of 10 µM of the EGFR–erbB2 inhibitor PKI166 (PKI). A significant increase in p-EGFR, p-erbB2, and p-Erk1/2 levels was detectable in keratinocytes upon Dsg1 silencing (Dsg1 KD) along with decreased K10/Dsc1. Blocking EGFR signaling using PKI166 suppressed p-EGFR, p-erbB2, and p-Erk levels in addition to restoring the capacity of Dsg1-deficient keratinocytes to differentiate. Ratios of p-EGFR to total EGFR or p-Erk1/2 to total Erk1/2 are indicated above the blots. Tx, treatment. (C) Dual-label indirect immunofluorescence and Apotome optical sectioning of Dsg1-Flag and EGFR after 4 h in high Ca2+ revealed areas of overlap in discrete regions of cell–cell contact (zoom) but not throughout the cell. The boxed area is magnified in the right panel. (D) Keratinocytes were transduced with EGFP, WT Dsg1-Flag (DG1-WT), or a soluble, truncated Dsg1 mutant (ΔN-DG1) and switched into high Ca2+ before being harvested in RIPA buffer. The insoluble pellet was resuspended in buffered SDS and run in parallel with equal protein amounts from the RIPA-soluble fraction. The ratio of insoluble/total erbB2, EGFR, E-cadherin (E-cad), and K14 is presented in the bar graph and is representative of three experiments. Full-length but not the truncated Dsg1 recruits EGFR–erbB2 into a more insoluble fraction where keratins are concentrated. Under these detergent conditions, the vast majority of E-cadherin remains in the soluble fraction. (E) Activation of EGFR-Ras-Raf-Erk signaling effectors as well as the EGFR–Erk1/2 gene target, EphA2, were elevated by Dsg1 knockdown but not chronic ETA treatment in rafts. Ratios of p-Erk to total Erk are indicated above the blots. GAPDH, glyceraldehyde-3-phosphate dehydrogenase. Bars: (A) 50 µm; (C) 20 µm.
Figure 8.
Figure 8.
Erk1/2 inhibition restores epidermal differentiation in Dsg1-deficient keratinocytes. (A) Western blot analysis of control or Dsg1 knockdown (KD) raft cultures incubated in the presence of vehicle control (DMSO) or 5 µM U0126. U0126 restored p-Erk1/2 to control levels and was able to increase Dsc1/K10/loricrin on the background of Dsg1 silencing. GAPDH, glyceraldehyde-3-phosphate dehydrogenase. (B) IHC analysis of K10 in 3-d-old control or Dsg1-deficient rafts treated with DMSO or U0126. Erk1/2 inhibition led to markedly improved suprabasal K10 expression. The dotted lines indicate the boundary between keratinocytes and the collagen matrix. (C) Treatment (Tx) of Dsg1-deficient keratinocytes with an inhibitor of Erk1/2 (5 µM U0126) or p38 MAPK (10 µM SB203580) signaling in submerged cultures induced to differentiate for an additional 2 d. Western blot analysis revealed a restoration of loricrin and K10/Dsc1 (not depicted) levels toward control keratinocytes upon suppression of p-Erk1/2 levels despite the lack of Dsg1. U0126 suppressed p-Erk1/2 and reduced downstream c-Fos and EphA2 expression but had no effect on p-AKT levels. Keratinocyte differentiation was not rescued using SB203580, which decreased c-Fos expression but not p-Erk1/2, p-AKT, or EphA2 levels. (A and C) Ratios of p-Erk to total Erk are indicated above the blots. (D) A model depicting the coordination of EGFR–Erk1/2 signaling and Dsg expression during epidermal differentiation. The expression of Dsg2 and Dsg3 is permissive for EGFR–Erk1/2 signaling in the basal layer, which suppresses terminal differentiation. In contrast, the induction of Dsg1 in the suprabasal layers dampens EGFR–Erk1/2 activity, allowing for the progression into a more differentiated state and expression of Dsc1, K10, and loricrin. Our findings predict that shifting the balance toward Dsg1 would cause premature differentiation, whereas the absence of Dsg1 in the suprabasal epidermis is expected to limit differentiation via the sustained activity of EGFR–Erk1/2. Consistent with animal models in which Dsg2 has been transgenically overexpressed (Brennan et al., 2007), increasing this desmosomal cadherin in the suprabasal layers can compete with Dsg1 function and promote persistent EGFR–Erk1/2 signaling and impaired differentiation. Bar, 50 µm.

References

    1. Allen E., Yu Q.C., Fuchs E. 1996. Mice expressing a mutant desmosomal cadherin exhibit abnormalities in desmosomes, proliferation, and epidermal differentiation.J. Cell Biol. 133:1367–1382 - PMC - PubMed
    1. Amagai M., Matsuyoshi N., Wang Z.H., Andl C., Stanley J.R. 2000. Toxin in bullous impetigo and staphylococcal scalded-skin syndrome targets desmoglein 1.Nat. Med. 6:1275–1277 - PubMed
    1. Arnemann J., Sullivan K.H., Magee A.I., King I.A., Buxton R.S. 1993. Stratification-related expression of isoforms of the desmosomal cadherins in human epidermis.J. Cell Sci. 104:741–750 - PubMed
    1. Bailleul B., Surani M.A., White S., Barton S.C., Brown K., Blessing M., Jorcano J., Balmain A. 1990. Skin hyperkeratosis and papilloma formation in transgenic mice expressing a ras oncogene from a suprabasal keratin promoter.Cell. 62:697–708 - PubMed
    1. Bazzi H., Getz A., Mahoney M.G., Ishida-Yamamoto A., Langbein L., Wahl J.K., III, Christiano A.M. 2006. Desmoglein 4 is expressed in highly differentiated keratinocytes and trichocytes in human epidermis and hair follicle.Differentiation. 74:129–140 - PubMed

Publication types

MeSH terms