. 2009 Sep;183(1):249-58.
doi: 10.1534/genetics.109.104042. Epub 2009 Jun 22.

Frequency spectrum neutrality tests: one for all and all for one

Affiliations

Frequency spectrum neutrality tests: one for all and all for one

Guillaume Achaz. Genetics. 2009 Sep.

Abstract

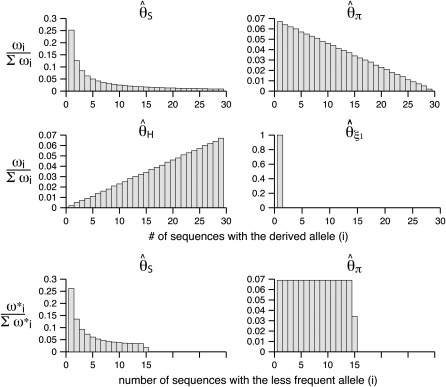
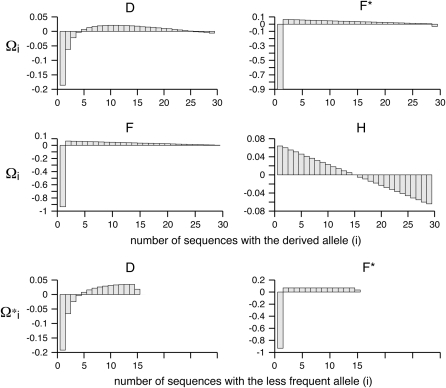
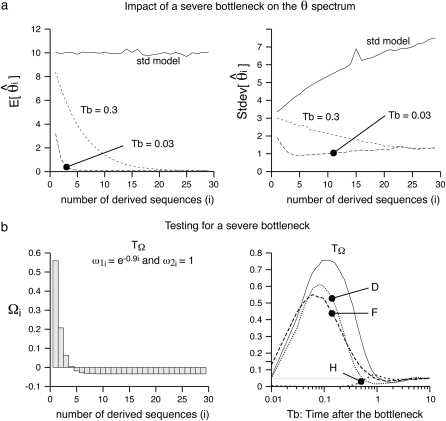
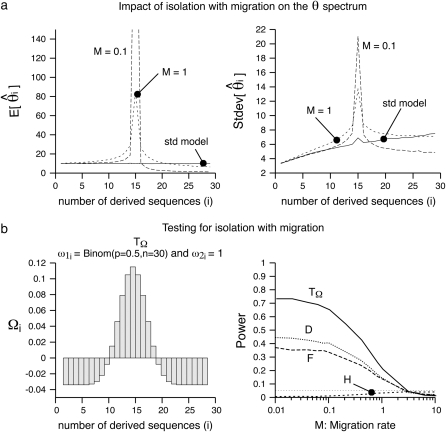
Neutrality tests based on the frequency spectrum (e.g., Tajima's D or Fu and Li's F) are commonly used by population geneticists as routine tests to assess the goodness-of-fit of the standard neutral model on their data sets. Here, I show that these neutrality tests are specific instances of a general model that encompasses them all. I illustrate how this general framework can be taken advantage of to devise new more powerful tests that better detect deviations from the standard model. Finally, I exemplify the usefulness of the framework on SNP data by showing how it supports the selection hypothesis in the lactase human gene by overcoming the ascertainment bias. The framework presented here paves the way for constructing novel tests optimized for specific violations of the standard model that ultimately will help to unravel scenarios of evolution.


Figures

F<sc>igure</sc> 1.—
Figure 1.—
Estimators of θ. A graphical view of the weight vectors of four typical estimators of θ (for n = 30). All values of the normalized vector sum to 1. In the top four panels, the formula image-vectors that are defined for the unfolded frequency spectrum (formula image) are given, whereas the two bottom ones are the formula image-vectors that are defined for the folded frequency spectrum (formula image). For estimators that can be defined in terms of both formula image and formula image (here formula image and formula image), the latter can be computed from the former with formula image (when ini) or formula image (when i = ni).
F<sc>igure</sc> 2.—
Figure 2.—
Neutrality tests. A graphical view of the weight vectors of four typical neutrality tests (for n = 30). Because the formula image-vectors used for neutrality tests are computed as a difference between two normalized vectors, all values of formula image sum to 0. In the top four panels, the formula image-vectors that are defined for the unfolded frequency spectrum (formula image) are given, whereas the two bottom ones are the formula image-vectors that are defined for the folded frequency spectrum (formula image). For estimators that can be defined in terms of both formula image and formula image (here D and F *), the latter can be computed from the former in the way that formula image can be deduced from ωi.
F<sc>igure</sc> 3.—
Figure 3.—
Example of a severe bottleneck. (a) The mean and the standard deviation of the formula image spectrum that is observed in simulations (n = 30, 104 replicates) of a standard model or of a recent severe bottleneck (reduction of f = 1/100 for a time Tl = 0.1). In both times after the bottleneck (Tb = 0.03 and Tb = 0.3), the observed trend is similar: an excess in low frequency of formula image, though stronger for Tb = 0.03. (b) Left, the weight vector of a new neutrality test (here TΩ) is reported. It focuses its sensitivity on low frequencies: formula image. (b) Right, the power of four neutrality tests is compared in detecting a severe bottleneck as a function of the time elapsed after the bottleneck. The new test shows enhanced power to detect the bottleneck (more power for a longer time).
F<sc>igure</sc> 4.—
Figure 4.—
Isolation with migration. (a) The mean and the standard deviation of the formula image spectrum that is observed in simulations (n = 30, 104 replicates) of a standard model or of an isolation with migration model (two populations equally sampled, na = nb = 15 that were a single ancestral panmictic population at time Ti = 3). In both sampling migration rates between the two populations (M = 0.1 and M = 1), the observed trend is similar: an excess of formula image, though much stronger for M = 0.1. (b) Left, the weight vector of a new neutrality test (Tω) that focuses its sensitivity on i = 15. The weight vector used here is formula image, where formula image is obtained using a binomial with p = 0.5 and n = 30. (b) Right, the power of four neutrality tests is compared when detecting the population structure as a function of the migration rate. The new test displays much more power to detect the population structure.

References

    1. Achaz, G., 2008. Testing for neutrality in samples with sequencing errors. Genetics 179: 1409–1424. - PMC - PubMed
    1. Baudry, E., and F. Depaulis, 2003. Effect of misoriented sites on neutrality tests with outgroup. Genetics 165: 1619–1622. - PMC - PubMed
    1. Bersaglieri, T., P. C. Sabeti, N. Patterson, T. Vanderploeg, S. F. Schaffner et al., 2004. Genetic signatures of strong recent positive selection at the lactase gene. Am. J. Hum. Genet. 74: 1111–1120. - PMC - PubMed
    1. Clark, A. G., M. J. Hubisz, C. D. Bustamante, S. H. Williamson and R. Nielsen, 2005. Ascertainment bias in studies of human genome-wide polymorphism. Genome Res. 15: 1496–1502. - PMC - PubMed
    1. Depaulis, F., and M. Veuille, 1998. Neutrality tests based on the distribution of haplotypes under an infinite-site model. Mol. Biol. Evol. 15: 1788–1790. - PubMed

Publication types