

Diagnostic utility of flow cytometry in low-grade myelodysplastic syndromes: a prospective validation study
- PMID: 19546439
- PMCID: PMC2719029
- DOI: 10.3324/haematol.2009.008532
Diagnostic utility of flow cytometry in low-grade myelodysplastic syndromes: a prospective validation study
Abstract
Background: The diagnosis of myelodysplastic syndromes is not always straightforward when patients lack specific diagnostic markers, such as blast excess, karyotype abnormality, and ringed sideroblasts.
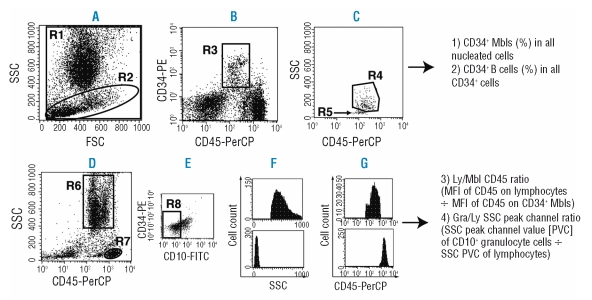
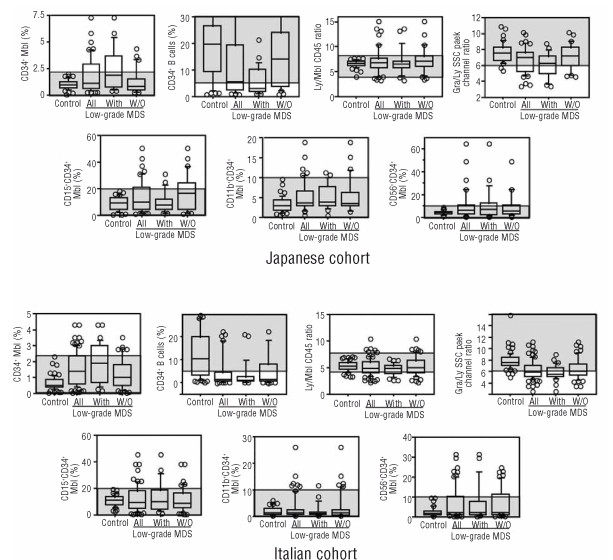
Design and methods: We designed a flow cytometry protocol applicable in many laboratories and verified its diagnostic utility in patients without those diagnostic markers. The cardinal parameters, analyzable from one cell aliquot, were myeloblasts (%), B-cell progenitors (%), myeloblast CD45 expression, and channel number of side scatter where the maximum number of granulocytes occurs. The adjunctive parameters were CD11b, CD15, and CD56 expression (%) on myeloblasts. Marrow samples from 106 control patients with cytopenia and 134 low-grade myelodysplastic syndromes patients, including 81 lacking both ringed sideroblasts and cytogenetic aberrations, were prospectively analyzed in Japan and Italy.
Results: Data outside the predetermined reference range in 2 or more parameters (multiple abnormalities) were common in myelodysplastic syndromes patients. In those lacking ringed sideroblasts and cytogenetic aberrations, multiple abnormalities were observed in 8/26 Japanese (30.8%) and 37/55 Italians (67.3%) when the cardinal parameters alone were considered, and in 17/26 Japanese (65.4%) and 42/47 Italians (89.4%) when all parameters were taken into account. Multiple abnormalities were rare in controls. When data from all parameters were used, the diagnostic sensitivities were 65% and 89%, specificities were 98% and 90%, and likelihood ratios were 28.1 and 8.5 for the Japanese and Italian cohorts, respectively.
Conclusions: This protocol can be used in the diagnostic work-up of low-grade myelodysplastic syndromes patients who lack specific diagnostic markers, although further improvement in diagnostic power is desirable.
Figures
Comment in
-
Flow cytometry immunophenotyping for diagnosis of myelodysplastic syndrome.Haematologica. 2009 Aug;94(8):1041-3. doi: 10.3324/haematol.2009.007682. Haematologica. 2009. PMID: 19644135 Free PMC article.
References
-
- Mufti GJ. Pathobiology, classification, and diagnosis of myelodysplastic syndrome. Best Pract Res Clin Haematol. 2004;17:543–57. - PubMed
-
- Cazzola M, Malcovati L. Myelodysplastic syndromes--coping with ineffective hematopoiesis. N Engl J Med. 2005;352:536–8. - PubMed
-
- Hamblin TJ. Epidemiology of the myelodysplastic syndromes. In: Bennett JM, editor. The Myelodysplastic Syndromes. New York: Marcel Dekker; 2002. pp. 15–27.
-
- Heaney ML, Golde DW. Myelodysplasia. N Engl J Med. 1999;340:1649–60. - PubMed
-
- Kouides PA, Bennett JM. Understanding the myelodysplastic syndromes. Oncologist. 1997;2:389–401. - PubMed
Publication types
MeSH terms
Substances
LinkOut - more resources
Full Text Sources
Medical
Research Materials
Miscellaneous
