. 2009 Jul;119(7):2062-73.
doi: 10.1172/JCI38714. Epub 2009 Jun 22.

Dendritic cell entrapment within the pregnant uterus inhibits immune surveillance of the maternal/fetal interface in mice

Affiliations

Dendritic cell entrapment within the pregnant uterus inhibits immune surveillance of the maternal/fetal interface in mice

Mary K Collins et al. J Clin Invest. 2009 Jul.

Abstract

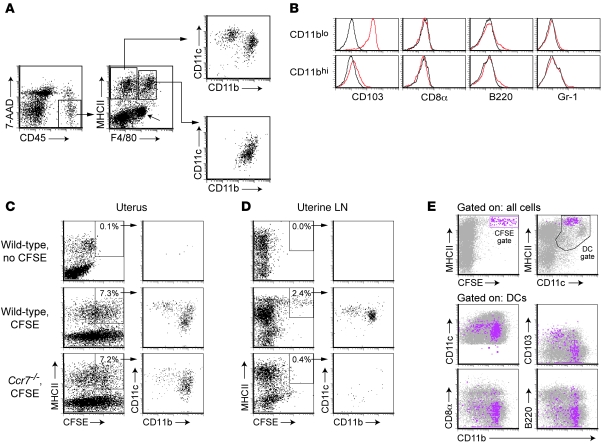
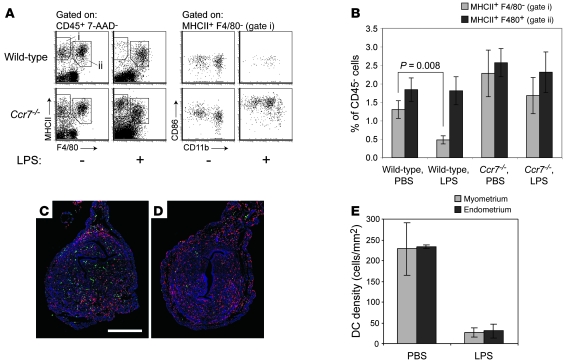
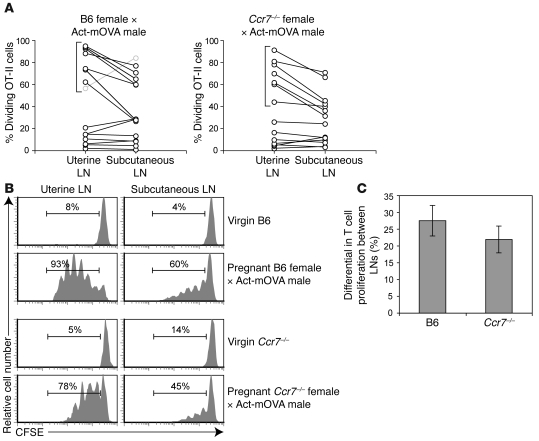
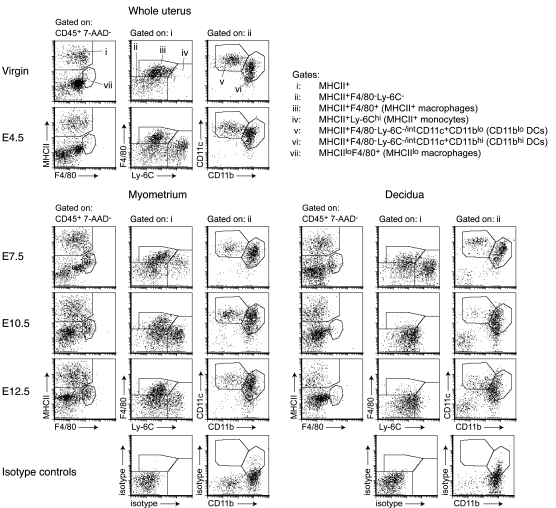
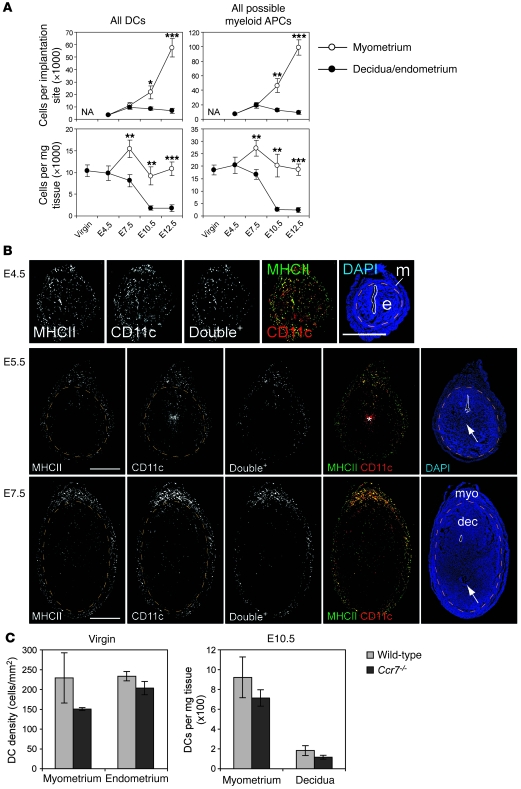
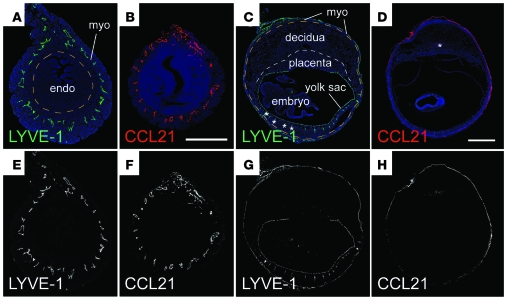
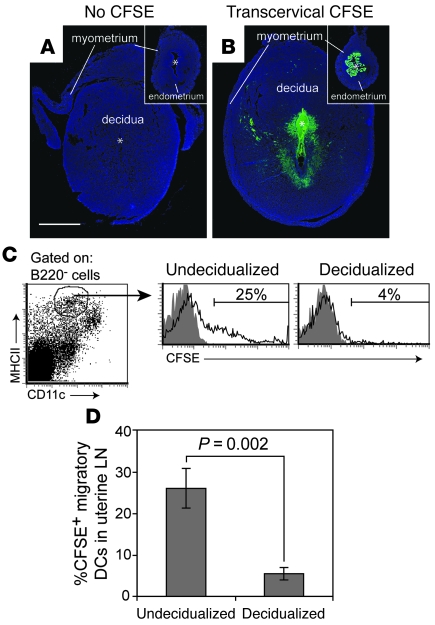
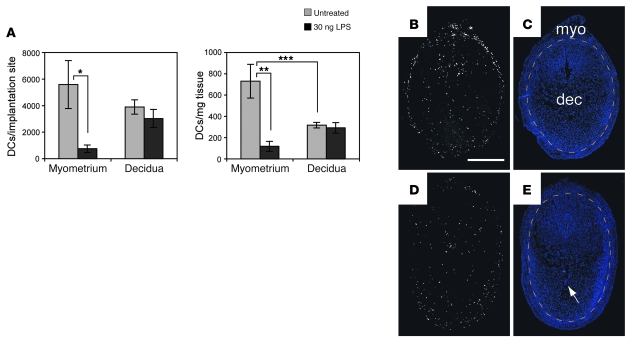
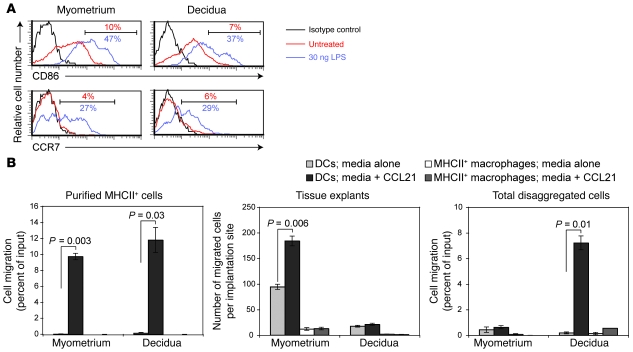
Embryo implantation induces formation of the decidua, a stromal cell-derived structure that encases the fetus and placenta. Using the mouse as a model organism, we have found that this tissue reaction prevents DCs stationed at the maternal/fetal interface from migrating to the lymphatic vessels of the uterus and thus reaching the draining lymph nodes. Strikingly, decidual DCs remained immobile even after being stimulated with LPS and exhibiting responsiveness to CCL21, the chemokine that drives DC entry into lymphatic vessels. An analysis of maternal T cell reactivity toward a surrogate fetal/placental antigen furthermore revealed that regional T cell responses toward the fetus and placenta were driven by passive antigen transport and thus the tolerogenic mode of antigen presentation that predominates when there is negligible input from tissue-resident DCs. Indeed, the lack of involvement of tissue-resident DCs in the T cell response to the fetal allograft starkly contrasts with their prominent role in organ transplant rejection. Our results suggest that DC entrapment within the decidua minimizes immunogenic T cell exposure to fetal/placental antigens and raise the possibility that impaired development or function of the human decidua, which unlike that of the mouse contains lymphatic vessels, might lead to pathological T cell activation during pregnancy.


Figures

Figure 1
Figure 1. Identification of migratory DCs in the nonpregnant uterus.
(A) A basic gating scheme to identify uterine DCs. Viable leukocytes were visualized using anti-CD45 antibodies in combination with the nucleic acid dye 7-aminoactinomycin D (7-AAD) to exclude dead cells. MHCII+F4/80 cells divided into 2 putative DC subsets with CD11c+CD11blo and CD11c+CD11bhi surface phenotypes; MHCII+F4/80+ cells were CD11clo. The diagonal arrow indicates an MHCIIF4/80+ population largely consisting of eosinophils based upon their high side scatter characteristics (data not shown). (B) Cell-surface marker expression by MHCII+F4/80 DC subsets (red histograms). Black histograms show isotype control staining. (C and D) CCR7-dependent arrival of CFSE+ cells in the uterine LNs after CFSE labeling the uterus in situ. Flow cytometric analysis of total uterine cell suspensions (C) and respective uterine LN cells (D) 28 hours after transcervical CFSE injection. The plots are gated on alive CD45+ cells, and the percentage of CD45+ MHCII+ cells that are CFSE+ is indicated. Data are representative of n = 4–6 mice per group. (E) Cell-surface marker profiles of CFSEbright cells in the uterine LNs. CFSEbright gated cells (fuchsia) are show in the lower 4 panels overlaying the general distribution of DCs gated as indicated. In addition, CFSEbright cells did not express F4/80, Ly-6C, or Gr-1 (data not shown). In confirmation of the paraaortic and renal LNs being the draining LN of the murine uterus, only these LNs accumulated CFSEbright cells following transcervical CFSE injection into wild-type mice.
Figure 2
Figure 2. CCR7-dependent selective loss of DCs from the nonpregnant uterus following LPS stimulation.
(A) Flow cytometric analysis of uterine leukocytes 28 hours after intravenous LPS injection. The number of cells shown for each mouse is normalized to a fixed number of CD45 non-rbc, which we used as estimates of uterine parenchymal cell number. CD86 expression levels by those few uterine DCs remaining in LPS-treated wild-type mice varied between individual mice. (B) Cell numbers for LPS- and control PBS-treated mice were calculated by flow cytometry using the gates shown in A and were normalized to CD45 non-rbc. Data show mean ± SEM of n = 6–7 mice per group, compiled from 3 independent experiments. (C and D) Representative sections of uteri from PBS- (C) and LPS-treated (D) mice, immunostained with anti-MHCII (green) and anti-F4/80 (red) antibodies. DCs are pure green (MHCII+F4/80) cells. Color intensities in both images were subjected to the same set of nonlinear adjustments so that the cells would be visible at low magnification. Scale bar: 0.5 mm. (E) Histomorphometric quantification of DC densities in the myometrium and endometrium of PBS- and LPS-treated mice (mean ± SD; n = 3 mice per group).
Figure 3
Figure 3. CCR7-independent presentation of a surrogate fetal/placental antigen in the uterine LN.
(A) Quantification of OVA-driven OT-II cell proliferation in the uterine and subcutaneous LNs of Act-mOVA–mated wild-type B6 (left) and Ccr7–/– (right) mice. Mice were sacrificed 60 hours after being intravenously injected with 2 × 10⁶ CFSE-labeled OT-II cells on a day of gestation ranging between E8.5 and 16.5. Individual mice are represented as linked data points. The percentage of dividing cells was determined as shown in B. Background proliferation in virgin and B6 × B6 pregnant mice was 4%–14%. (B) Representative OT-II CFSE dilution profiles for virgin B6, virgin Ccr7–/–, and the mice bracketed in A. The percentage of T cells that have undergone at least one division is indicated. (C) Average difference in percent proliferation ± SEM between the uterine and subcutaneous LNs for the respective groups of mice bracketed in A (n = 7 mice per group). The B6 average excludes the atypical mouse represented by the gray symbols in A.
Figure 4
Figure 4. Identification of DCs in the pregnant uterus.
Multicolor flow cytometry was used to characterize relevant cell populations based upon an initial CD45+7-AAD gate to identify viable leukocytes (not shown). Isotype control plots show data from E10.5 but are representative of all time points. Since the very little decidual tissue present on E4.5 cannot be easily dissected from the myometrium, data for this time point should be taken to represent the total cell composition of the pregnant uterus at this stage of gestation. In contrast to the uteri of progesterone-treated virgins, the E4.5 uterus contained a large number of MHCII+Ly-6Chi monocytes (gate iv) that were also apparent on E0.5 and in virgin females at a random stage of their estrous cycle (data not shown). These differences are consistent with the known effects of sex hormones on uterine leukocyte composition (–15). The cells persisted in the myometrium through E12.5 and were present in the decidua through E7.5 as previously described (4). From E4.5 to E12.5, myeloid MHCII+ cells in the decidua appeared increasingly homogeneous due to decreased F4/80 expression, increased basal Ly-6C expression, and the disappearance of the MHCII+Ly-6Chi monocyte population by E10.5. The F4/80 staining is not as distinct as that shown in Figures 1 and 2 since our multicolor analysis required use of a dimmer fluorochrome.
Figure 5
Figure 5. DC dynamics in the pregnant uterus.
(A) Cell number per implantation site and cell number per milligram tissue (i.e., tissue density) for all DCs (sum of the v and vi gates of Figure 4) and all possible myeloid APCs (sum of the iii, iv, v, and vi gates of Figure 4). Data show mean ± SEM for n = 4–7 mice per group. *P < 0.05, **P < 0.02, ***P < 0.005 versus decidua. NA, not applicable. (B) Spatial distribution of uterine DCs during pregnancy. Transverse sections, with their mesometrial poles oriented upward, were double stained with antibodies against MHCII (green) and CD11c (red) and counterstained with DAPI. Single-channel images and combined MHCII/CD11c images after their “AND” gating (Double+ cells; see Methods) are shown in black and white. Uterine lumens are outlined with solid white lines, and orange dashed lines demarcate the undecidualized endometrium (e) from the myometrium (m) or the decidua (dec) from the myometrium (myo). The arrows indicate groups of trophoblasts lateral to implanted embryos. The asterisk indicates nonspecific staining. To visualize DCs in panoramic view, we manipulated the images as described in Methods; some are shown at higher magnification in Supplemental Figure 5. Scale bars: 1 mm. (C) Uterine DC densities in wild-type versus Ccr7–/– mice. Tissue densities in virgin mice, determined by histomorphometry, are shown as mean ± SD of n = 3 mice per group; densities on E10.5, determined by flow cytometry, are shown as mean ± SEM of n = 3–4 mice per group.
Figure 6
Figure 6. Lymphatic distribution and CCL21 expression in the nonpregnant and pregnant uterus.
Nonpregnant uteri (A, B, E, and F; scale bar: 0.5 mm) and E10.5 implantation sites (C, D, G, and H; scale bar: 1 mm) were stained with antibodies against the lymphatic vessel marker LYVE-1 (A, C, E, and G) or CCL21 (B, D, F, and H) and counterstained with DAPI. Color images are shown in AD; black and white images without the DAPI channel are shown in EH for clarity. The orange dashed lines in A and C demarcate the myometrium from endometrium and the myometrium from decidua, respectively. The white dashed line in C demarcates the placenta from decidua. In addition to lymphatic vessels, LYVE-1 is also expressed by yolk sac endothelial cells. The asterisks in C indicate some staining artifacts caused by tissue folding; the asterisk in D indicates some nonspecific staining also seen in the absence of primary antibody. Staining intensities were subjected to nonlinear adjustments so that structures would be visible at low magnification.
Figure 7
Figure 7. Decidualization reduces DC migration from the uterus to the draining LNs.
Mice with artificially decidualized or undecidualized uteri were injected transcervically with CFSE and sacrificed 28 hours later. (A and B) Transverse sections of uteri from uninjected (A) or CFSE-injected (B) mice were stained for CFSE using anti-FITC antibodies and counterstained with DAPI. Insets show undecidualized uteri magnified to the same extent as decidualized uteri. The myometrium has partially peeled away from the decidua in A. All images were subjected to same nonlinear adjustment so that CFSE staining intensities would be comparable, yet visible in a panoramic view. Scale bar: 1 mm (applies to all images). (C) Gating scheme and representative histograms showing the appearance of CFSE+ migratory DCs in the uterine LNs. Cells were gated on B220 cells to exclude B cells and thus help clarify the MHCIIhiCD11cint migratory DC population (see Figure 1E). Shaded and open histograms are from untreated and CFSE-injected mice, respectively. The percentage of CFSE+ cells was determined by setting the lower bound of the marker to give approximately 1% positive cells in the non-CFSE-injected group. (D) Mean percentage of CFSE+ migratory DCs (± SEM; n = 6 mice per group).
Figure 8
Figure 8. LPS fails to induce DC emigration from the decidua.
E6.5 pregnant mice remained untreated or were injected intravenously with 30 ng LPS. (A) Flow cytometry–based quantification of DC cell numbers per implantation site and DC tissue densities 28 hours after injection. DCs were enumerated as MHCII+F4/80CD11chi cells. The data show mean ± SEM for n = 6 mice per group. *P = 0.02, **P = 0.004, ***P = 0.03. We obtained the same results when we considered each DC subset individually (data not shown). (BE) Spatial distribution of DCs in implantation sites of untreated (B and C) and LPS-treated (D and E) mice 28 hours after injection. Transverse sections were double stained with anti-MHCII and anti-CD11c antibodies. (B and D) Combined images after their “AND” gating (i.e., Double+ cells as in Figure 5). (C and D) DAPI counterstaining. Orange dashed lines demarcate the decidua from the myometrium. The arrow indicates an implanted embryo. To visualize DCs in panoramic view, the images were manipulated as described in Methods. Scale bar: 1 mm. Data are representative of n = 3–5 mice per group.
Figure 9
Figure 9. Decidual DCs retain their cell-intrinsic maturation and migratory capacity yet are trapped within the tissue.
(A) CD86 and CCR7 expression levels on MHCII+F4/80CD11chi uterine DCs. The cells were harvested on E7.5 from untreated mice or mice that had been intravenously injected 15 hours earlier with 30 ng LPS. Percentages of cells with the indicated levels of expression are shown. Data are representative of n = 3 mice per group. (B) Ex vivo migration of cells from the myometrium or decidua toward medium alone or medium containing CCL21. The Transwell migration of DCs (MHCII+F4/80CD11chi) and MHCII+ macrophages (MHCII+F4/80+) from MHCII+ MACS-purified cells (left panel) or total disaggregated cells (right panel) are expressed as a percentage of their respective input cell number. The cells were isolated on E7.5 fifteen hours after the intravenous injection of 30 ng LPS. Data are mean ± SEM of 2 wells per group. These experiments were replicated 3 times with similar results. The middle panel shows the total number of cells (mean ± SEM of 5 mice per group compiled over 3 independent experiments) that emigrated out of intact tissue explants.

Comment in

References

    1. Trowsdale J., Betz A.G. Mother’s little helpers: mechanisms of maternal-fetal tolerance. Nat. Immunol. 2006;7:241–246. doi: 10.1038/ni1317. - DOI - PubMed
    1. Moffett A., Loke C. Immunology of placentation in eutherian mammals. Nat. Rev. Immunol. 2006;6:584–594. doi: 10.1038/nri1897. - DOI - PubMed
    1. Erlebacher A., Vencato D., Price K.A., Zhang D., Glimcher L.H. Constraints in antigen presentation severely restrict T cell recognition of the allogeneic fetus. J. Clin. Invest. 2007;117:1399–1411. doi: 10.1172/JCI28214. - DOI - PMC - PubMed
    1. Kruse A., Martens N., Fernekorn U., Hallmann R., Butcher E.C. Alterations in the expression of homing-associated molecules at the maternal/fetal interface during the course of pregnancy. Biol. Reprod. 2002;66:333–345. doi: 10.1095/biolreprod66.2.333. - DOI - PubMed
    1. Dey S.K., et al. Molecular cues to implantation. Endocr. Rev. 2004;25:341–373. doi: 10.1210/er.2003-0020. - DOI - PubMed

Publication types