Comparative Study
. 2009 Jun 16;7(6):e1000134.
doi: 10.1371/journal.pbio.1000134. Epub 2009 Jun 23.

Evolution of phosphoregulation: comparison of phosphorylation patterns across yeast species

Affiliations
Comparative Study

Evolution of phosphoregulation: comparison of phosphorylation patterns across yeast species

Pedro Beltrao et al. PLoS Biol. .

Erratum in

  • PLoS Biol. 2009 Nov;7(11). doi: 10.1371/annotation/66479889-5e57-4213-bf25-c4e8cf3d933b

Abstract

The extent by which different cellular components generate phenotypic diversity is an ongoing debate in evolutionary biology that is yet to be addressed by quantitative comparative studies. We conducted an in vivo mass-spectrometry study of the phosphoproteomes of three yeast species (Saccharomyces cerevisiae, Candida albicans, and Schizosaccharomyces pombe) in order to quantify the evolutionary rate of change of phosphorylation. We estimate that kinase-substrate interactions change, at most, two orders of magnitude more slowly than transcription factor (TF)-promoter interactions. Our computational analysis linking kinases to putative substrates recapitulates known phosphoregulation events and provides putative evolutionary histories for the kinase regulation of protein complexes across 11 yeast species. To validate these trends, we used the E-MAP approach to analyze over 2,000 quantitative genetic interactions in S. cerevisiae and Sc. pombe, which demonstrated that protein kinases, and to a greater extent TFs, show lower than average conservation of genetic interactions. We propose therefore that protein kinases are an important source of phenotypic diversity.


Conflict of interest statement

The authors have declared that no competing interests exist.

Figures

Figure 1
Figure 1. Evolution of phosphorylation levels for different functional groups.
(A) Proteins of S. cerevisiae, C. albicans, and Sc. pombe were grouped according to gene ontology functions, and for each function we calculated the fraction of phosphosites per protein normalized by the average number of phosphosites per protein in the proteome. We plotted the relative levels of phosphorylation of S. cerevisiae functions against the same measure in C. albicans. The size of each point relates to the relative levels of phosphorylation in Sc. pombe that range from 1.2 to 2.4 arbitrary units. The individual correlation coefficients among the three species are S. cerevisiae versus C. albicansR∼0.90; S. cerevisiae versus Sc. pombeR∼0.91; Sc. pombe versus C. albicansR∼0.88. Some functions were consistently found to be highly phosphorylated in all three species (annotated in the picture). (B and C) Proteins from the three species under study were grouped according to functional categories (B) or complex membership (C). For each group, the relative levels of phosphorylation were calculated for the three fungal species and represented in the form of a stacked graph. Those with a significant increase or decrease in phosphorylation are highlighted (see Methods). Asterisk indicates functions/complexes that also show a significant change in the relative fraction of phosphoproteins. Pound symbol (#) indicates functions/complexes that also show a significant difference in total number of proteins assigned in the orthologous group in the different species (see also Protocol S1).
Figure 2
Figure 2. Evolution of phosphoregulation of the pre-replication complex.
For S. cerevisiae, C. albicans, and Sc. pombe, proteins found to be phosphorylated experimentally are marked with “P.” (A) For each protein in the species studied, phosphorylation propensity was predicted based on sequence (see Methods) and represented in a color intensity gradient, where darker colors represent increasing predicted phosphorylation likelihood. The AROC value for the prediction of the phosphorylation pattern the three species is 0.67 using the LR method. White squares denote lack of predicted ortholog. (B) The top five kinases predicted to be associated with the ORC and MCM complexes in S. cerevisiae are shown along with the respective AROC value and significance value for prediction of the phosphorylation pattern for the three species (C) Cdc28p phosphorylation propensity was predicted from sequence and classified as poor (white), weak (light blue), or strong (dark blue). Gray denotes lack of predicted ortholog.
Figure 3
Figure 3. Evolution of phosphoregulation of the Clathrin associated protein complex.
S. cerevisiae, C. albicans, and Sc. pombe proteins found to be phosphorylated experimentally are marked with a “P.” (A) For each protein phosphorylation propensity was predicted based on sequence (see Methods) and represented in a color intensity gradient where darker colors represent increasing predicted phosphorylation likelihood. The AROC value for the prediction of the phosphorylation pattern in the three species is 0.76 using the GPS method. White squares denote lack of predicted ortholog. (B) Casein kinase I type (Yck1p, Yck2p, Yck3p, and Hrr25p) phosphorylation propensity was predicted from sequence and classified as poor (white), weak (light blue), or strong (dark blue). Casein kinase type I phosphorylation propensity predicts this phosphorylation pattern with an AROC value of 0.63. Gray denotes lack of predicted ortholog.
Figure 4
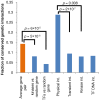
Figure 4. Functional divergence of protein kinases and transcription factors.
Genetic interactions were compiled for orthologous gene pairs in S. cerevisiae and Sc. pombe. We compared the level of conservation of genetic interactions involving protein kinases and transcription factors to the average conservation of S. cerevisiae genetic interactions. The conservation of genetic interactions that overlap with protein–protein interactions were compared with physical interactions involving at least one protein kinase and with transient interactions. Physical interactions were defined as transient if they were experimentally determined by methods capable of capturing transient interactions (see Methods). The number of conserved interactions for each category is as follows: average gene pairs: 761 out of 5,322; kinases versus random genes: 38 out of 472; TFs versus random genes: 6 out of 141; physical interactions: 67 out of 233; transient interactions: 8 out of 85; kinase interactions: 2 out of 25; TF–gene interactions: 4 out of 48.

Comment in

References

    1. Wapinski I, Pfeffer A, Friedman N, Regev A. Natural history and evolutionary principles of gene duplication in fungi. Nature. 2007;449:54–61. - PubMed
    1. King N, Westbrook MJ, Young SL, Kuo A, Abedin M, et al. The genome of the choanoflagellate Monosiga brevicollis and the origin of metazoans. Nature. 2008;451:783–788. - PMC - PubMed
    1. Kellis M, Birren BW, Lander ES. Proof and evolutionary analysis of ancient genome duplication in the yeast Saccharomyces cerevisiae. Nature. 2004;428:617–24. - PubMed
    1. Dujon B, Sherman D, Fischer G, Durrens P, Casaregola S, et al. Genome evolution in yeasts. Nature. 2004;430:35–44. - PubMed
    1. Landry CR, Lemos B, Rifkin SA, Dickinson WJ, Hartl DL. Genetic properties influencing the evolvability of gene expression. Science. 2007;317:118–121. - PubMed

Publication types

MeSH terms