. 2009 Jun 16;7(6):e1000137.
doi: 10.1371/journal.pbio.1000137. Epub 2009 Jun 23.

Self-organization of the Escherichia coli chemotaxis network imaged with super-resolution light microscopy

Affiliations

Self-organization of the Escherichia coli chemotaxis network imaged with super-resolution light microscopy

Derek Greenfield et al. PLoS Biol. .

Abstract

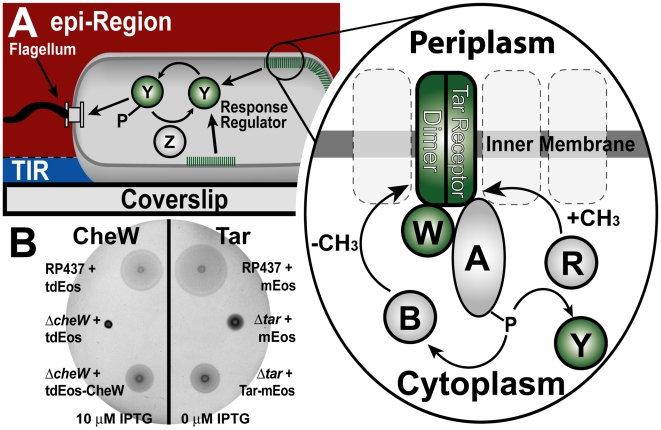
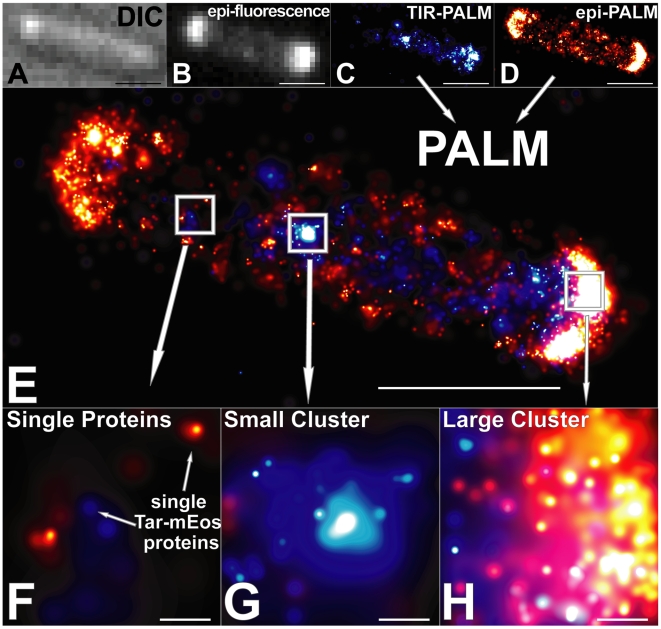
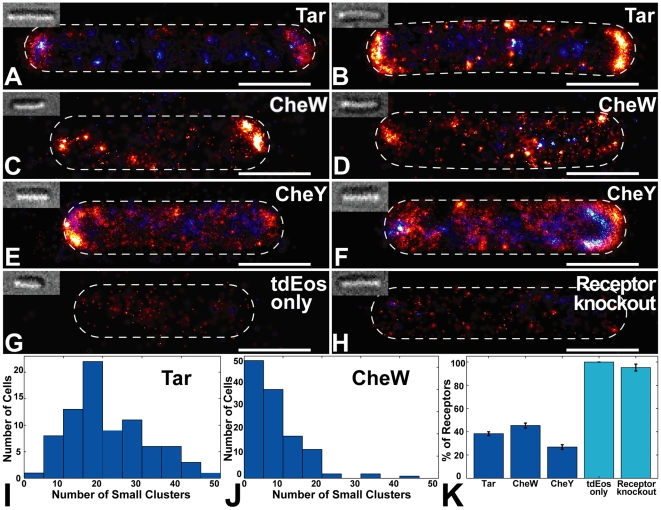
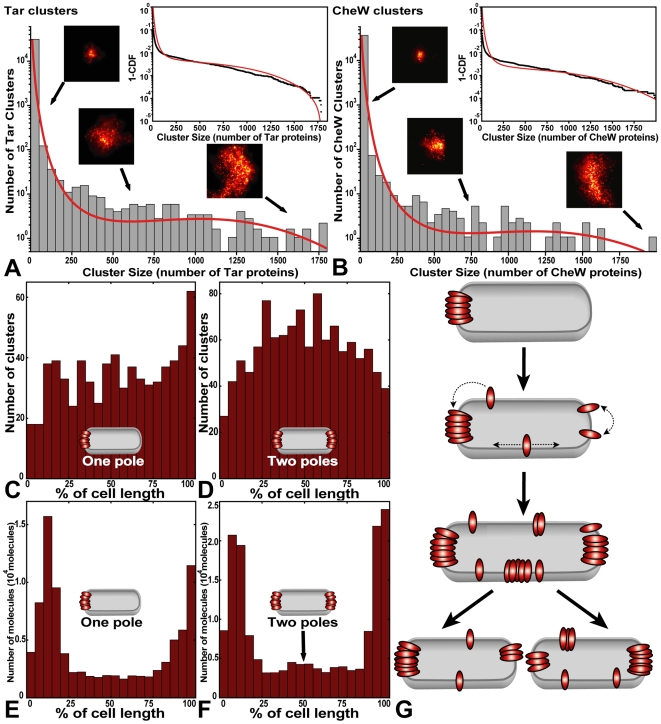
The Escherichia coli chemotaxis network is a model system for biological signal processing. In E. coli, transmembrane receptors responsible for signal transduction assemble into large clusters containing several thousand proteins. These sensory clusters have been observed at cell poles and future division sites. Despite extensive study, it remains unclear how chemotaxis clusters form, what controls cluster size and density, and how the cellular location of clusters is robustly maintained in growing and dividing cells. Here, we use photoactivated localization microscopy (PALM) to map the cellular locations of three proteins central to bacterial chemotaxis (the Tar receptor, CheY, and CheW) with a precision of 15 nm. We find that cluster sizes are approximately exponentially distributed, with no characteristic cluster size. One-third of Tar receptors are part of smaller lateral clusters and not of the large polar clusters. Analysis of the relative cellular locations of 1.1 million individual proteins (from 326 cells) suggests that clusters form via stochastic self-assembly. The super-resolution PALM maps of E. coli receptors support the notion that stochastic self-assembly can create and maintain approximately periodic structures in biological membranes, without direct cytoskeletal involvement or active transport.


Conflict of interest statement

The authors declare competing financial interests. EB and Harald Hess (Janelia Farm) have licensed the PALM technology to Carl Zeiss Microimaging, GmbH.

Figures

Figure 1
Figure 1. Membrane receptor clusters transduce chemotatic signals.
(A) Schematic of E. coli cell imaged in PALM. Regions of the cell PALMed in TIR and epi-illumination are shown. Right: zoom of circled region denoted in (A) shows the chemotaxis signal transduction pathway. Proteins in green were labeled with Eos including a receptor dimer (Tar), CheW, and CheY. P denotes phosphate group and CH3 is a methyl group. (B) Swarm plates show Eos-tagged chemotaxis proteins support chemotaxis. E. coli cells were spotted on minimal phosphate soft-agar plates with 100 µM aspartate and ampicillin, and allowed to swarm for 16–18 h at 30°C (Materials and Methods). Shown are wild-type RP437 cells containing only cytoplasmic Eos (positive control; top), knockout strains with cytoplasmic Eos (negative control; middle), and knockout strains complemented with Eos-tagged chemotaxis proteins (imaged cells; bottom). Complementation demonstrates that Eos-tagged proteins are partially functional, although not as efficient as the wild-type proteins. CheW (left) and Tar (right) fusion proteins support chemotaxis at 10 µM IPTG induction and no induction, respectively (Figure S1). Note that RP437 Δtar cells are weakly chemotactic due to the presence of other receptors.
Figure 2
Figure 2. E. coli Δtar cell with mEos-labeled Tar.
(A) Differential interference contrast (DIC) image of a single cell. (B) Diffraction-limited epi-fluorescence (epi). (C) PALM image in TIR-illumination. Each protein is represented as a 2-D Gaussian distribution whose width is the positional error for that protein. (D) PALM image in epi-illumination, taken after Tar-mEos proteins in the TIR region are bleached. (E) Superposition of (C) and (D). (F) Zoom of single proteins (n = 44 Tar proteins) in left boxed region of (E). (G) Zoom of small cluster (n = 241 Tar proteins) in middle boxed region of (E). (H) Zoom of large polar cluster (n = 722 Tar proteins) in right boxed region in (E). Scale bar in (A–E) indicates 1 µm. Scale bar in (F–H) indicates 50 nm.
Figure 3
Figure 3. PALM images of single cells reveal small chemotaxis clusters.
Single-cell PALM images containing 3,000–13,000 labeled chemotaxis proteins per cell. Largest chemotaxis clusters are found at the poles, small lateral clusters are found in all cells. DIC images (inset) correspond to cell outlines (dashed lines). (A and B) Two representative Δtar cells with pALM6001 (Tar-mEos). (C and D) Two representative ΔcheW cells with pALM 5001 (tdEos-CheW). (E and F) Two representative ΔcheY cells with pALM5003 (CheY-tdEos). Although CheY-tdEos does not support chemotaxis, its abundance in polar regions suggests it retains functional interactions with chemotaxis clusters. (G) Fluorescent reporter tdEos (pALM5000) does not form clusters without fusion to chemotaxis proteins. (H) tdEos-CheW does not form clusters in a receptor knockout strain. Scale bar in (A–H) is 1 µm. (I and J) Histograms of the number of small clusters (10–100 proteins) of Tar-mEos ([I] n = 84 cells) or tdEos-CheW ([J] n = 130 cells). (K) Percentage of proteins that are found in small clusters (<100 proteins) or as solitary receptors. Error bars indicate the standard error of the mean.
Figure 4
Figure 4. Chemotaxis cluster-size distribution and model.
(A and B) Histograms of cluster size, measured by the number of closely spaced Eos-labeled Tar (A) and CheW (B) proteins. Smaller clusters occur much more frequently than larger clusters. Sample images of clusters are shown with arrows that indicate cluster size. To evaluate the fit in a bin-independent representation, we plotted the cumulative distribution function (CDF) (insets). The fit of our self-assembly model to our data is shown in red. (C and D) Cells with one (C) or two (D) large polar clusters (n≥400 proteins) have the highest density of remaining smaller clusters (n<400) furthest from the existing cluster(s). (E and F) Cells with two large polar clusters (F) exhibit higher Tar-receptor density at mid-cell (arrow) in comparison to cells with one polar cluster (E). n = 31 cells for (C and E), and 38 cells for (D and F). (G) Model of receptor self-assembly in which cluster locations are maintained within a population of growing and dividing cells. Cluster nucleation is most likely to occur where receptor density is high, which occurs far from any existing cluster. Dotted arrows denote receptor diffusion within the membrane.

References

    1. Adler J. Chemotaxis in bacteria. Annu Rev Biochem. 1975;44:341–356. - PubMed
    1. Ames P, Studdert C, Reiser R, Parkinson J. Collaborative signaling by mixed chemoreceptor teams in Escherichia coli. Proc Natl Acad Sci U S A. 2002;99:7060–7065. - PMC - PubMed
    1. Kim KK, Yokota H, Kim S-H. Four-helical-bundle structure of the cytoplasmic domain of a serine chemotaxis receptor. Nature. 1999;400:787–792. - PubMed
    1. Maddock J, Shapiro L. Polar localization of the chemoreceptor complex in the E. coli cell. Science. 1993;259:1717–1723. - PubMed
    1. Baker M, Wolanin P, Stock J. Signal transduction in bacterial chemotaxis. BioEssays. 2006;28:9–22. - PubMed

Publication types

MeSH terms