

Bioluminescence imaging in mouse models quantifies beta cell mass in the pancreas and after islet transplantation
- PMID: 19548035
- PMCID: PMC3822006
- DOI: 10.1007/s11307-009-0240-1
Bioluminescence imaging in mouse models quantifies beta cell mass in the pancreas and after islet transplantation
Abstract
Purpose: We developed a mouse model that enables non-invasive assessment of changes in beta cell mass.
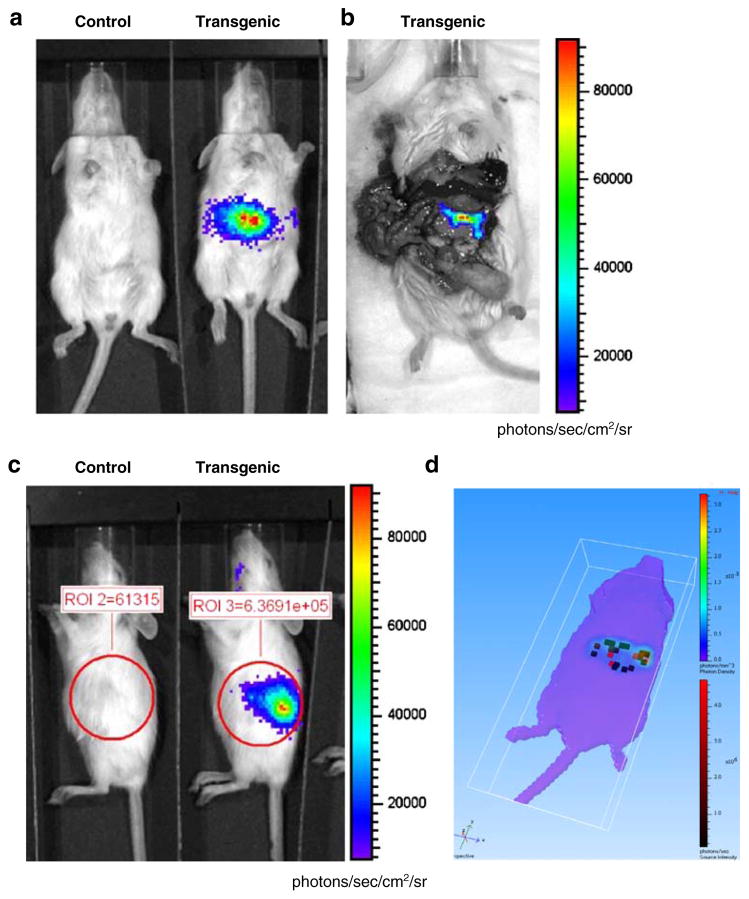
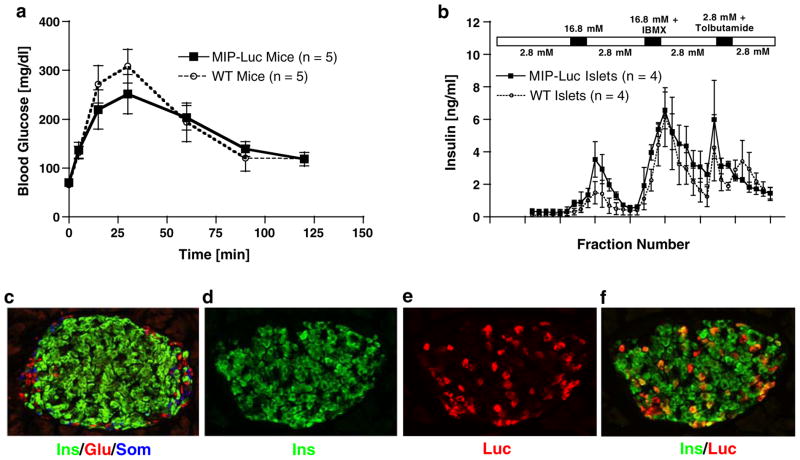
Procedures: We generated a transgenic mouse expressing luciferase under control of the mouse insulin I promoter [mouse insulin promoter-luciferase-Vanderbilt University (MIP-Luc-VU)] and characterized this model in mice with increased or decreased beta cell mass and after islet transplantation.
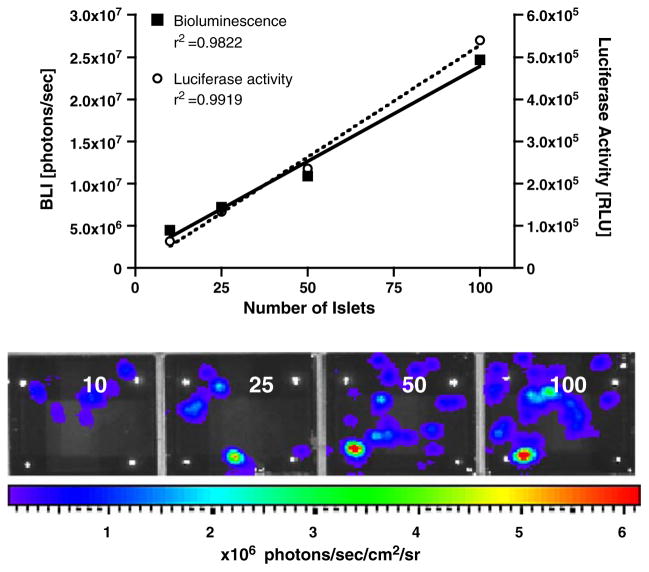
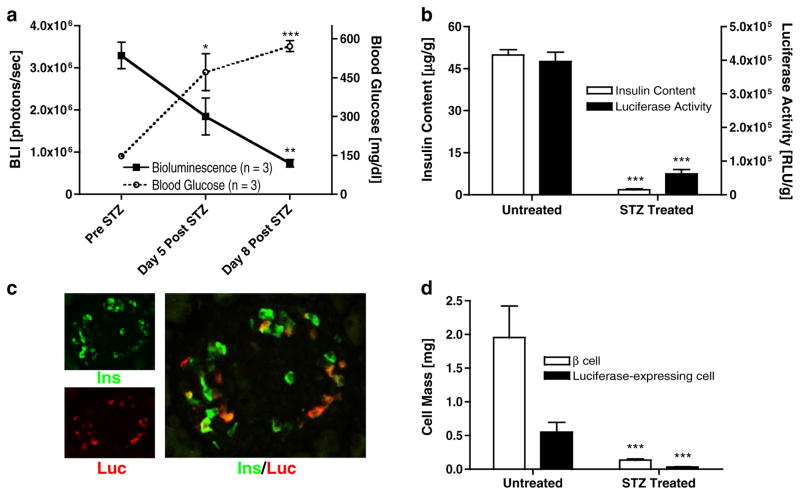
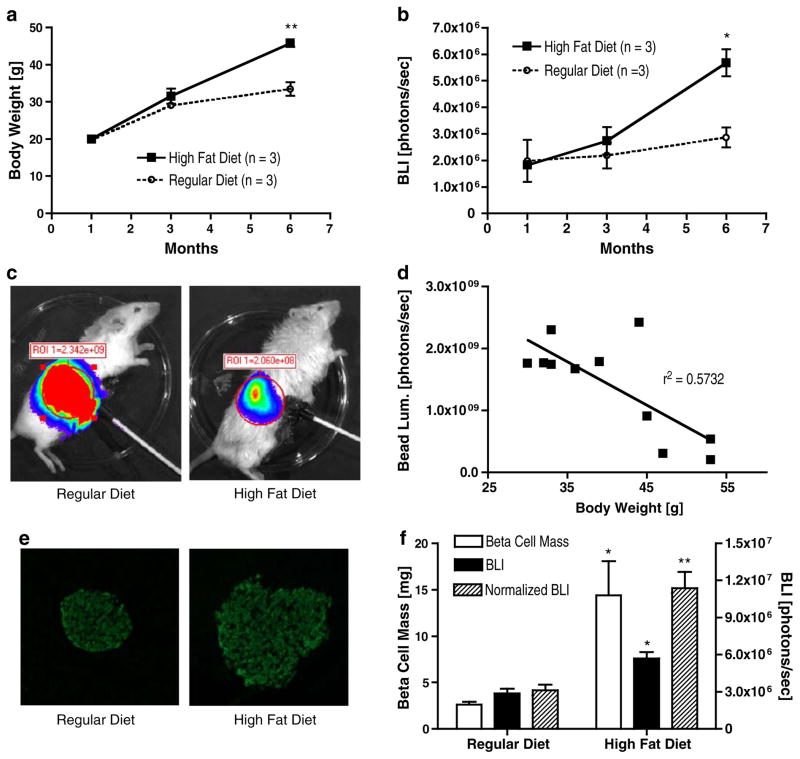
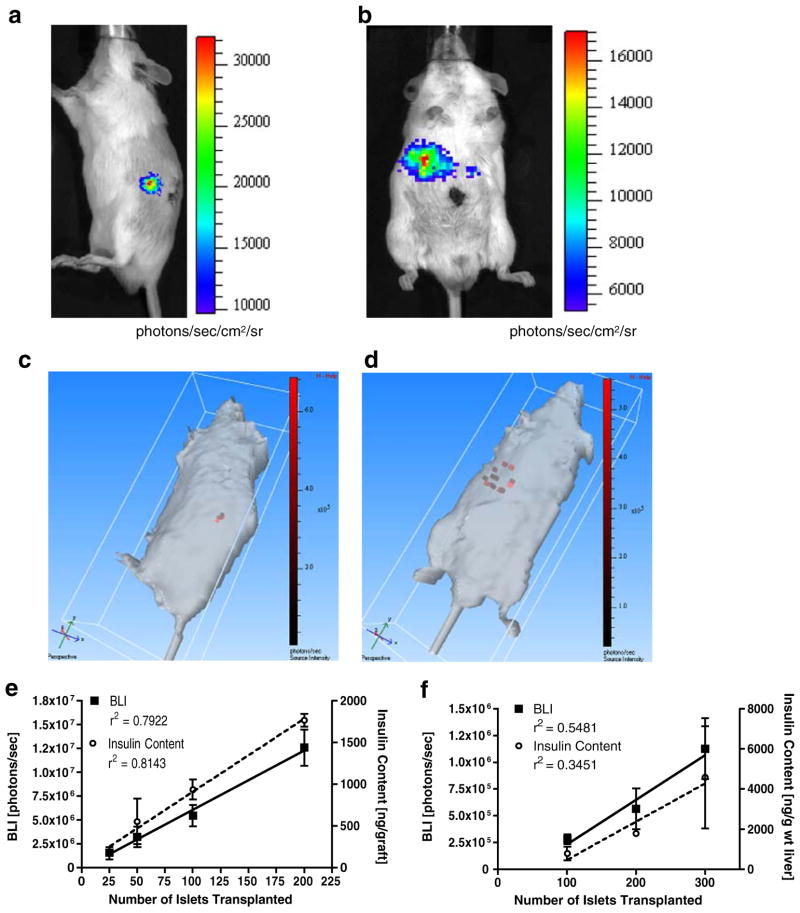
Results: Streptozotocin-induced, diabetic MIP-Luc-VU mice had a progressive decline in bioluminescence that correlated with a decrease in beta cell mass. MIP-Luc-VU animals fed a high-fat diet displayed a progressive increase in bioluminescence that reflected an increase in beta cell mass. MIP-Luc-VU islets transplanted beneath the renal capsule or into the liver emitted bioluminescence proportional to the number of islets transplanted and could be imaged for more than a year.
Conclusions: Bioluminescence in the MIP-Luc-VU mouse model is proportional to beta cell mass in the setting of increased and decreased beta cell mass and after transplantation.
Figures
Similar articles
-
Bioluminescence imaging of β cells and intrahepatic insulin gene activity under normal and pathological conditions.PLoS One. 2013 Apr 4;8(4):e60411. doi: 10.1371/journal.pone.0060411. Print 2013. PLoS One. 2013. PMID: 23593212 Free PMC article.
-
Noninvasive monitoring of β-cell mass and fetal β-cell genesis in mice using bioluminescence imaging.Exp Anim. 2012;61(4):445-51. doi: 10.1538/expanim.61.445. Exp Anim. 2012. PMID: 22850644
-
Noninvasive monitoring of changes in pancreatic beta-cell mass by bioluminescent imaging in MIP-luc transgenic mice.Horm Metab Res. 2009 Jan;41(1):1-4. doi: 10.1055/s-0028-1087209. Epub 2008 Oct 23. Horm Metab Res. 2009. PMID: 18949679 Free PMC article.
-
Seeing is believing: how the MIP-luc mouse can advance the field of islet transplantation and β-cell regeneration.Islets. 2010 Jul-Aug;2(4):261-2. doi: 10.4161/isl.2.4.12028. Islets. 2010. PMID: 21099322 Review.
-
[Novel Technology for Studying Insulin Secretion: Imaging and Quantitative Analysis by a Bioluminescence Method].Yakugaku Zasshi. 2020;140(8):969-977. doi: 10.1248/yakushi.20-00012-2. Yakugaku Zasshi. 2020. PMID: 32741870 Review. Japanese.
Cited by
-
Enhancing pancreatic Beta-cell regeneration in vivo with pioglitazone and alogliptin.PLoS One. 2013 Jun 6;8(6):e65777. doi: 10.1371/journal.pone.0065777. Print 2013. PLoS One. 2013. PMID: 23762423 Free PMC article.
-
Bioluminescence imaging of β cells and intrahepatic insulin gene activity under normal and pathological conditions.PLoS One. 2013 Apr 4;8(4):e60411. doi: 10.1371/journal.pone.0060411. Print 2013. PLoS One. 2013. PMID: 23593212 Free PMC article.
-
Molecular imaging of β-cells: diabetes and beyond.Adv Drug Deliv Rev. 2019 Jan 15;139:16-31. doi: 10.1016/j.addr.2018.06.022. Epub 2018 Jul 3. Adv Drug Deliv Rev. 2019. PMID: 31378283 Free PMC article. Review.
-
Experimental approaches for high-resolution in vivo imaging of islet of Langerhans biology.Curr Diab Rep. 2011 Oct;11(5):420-5. doi: 10.1007/s11892-011-0207-x. Curr Diab Rep. 2011. PMID: 21701794 Review.
-
Knockdown of aberrantly upregulated aryl hydrocarbon receptor reduces tumor growth and metastasis of MDA-MB-231 human breast cancer cell line.Int J Cancer. 2013 Dec 15;133(12):2769-80. doi: 10.1002/ijc.28297. Epub 2013 Jul 5. Int J Cancer. 2013. PMID: 23733406 Free PMC article.
References
-
- Robertson RP. Islet transplantation as a treatment for diabetes—a work in progress. N Engl J Med (USA) 2004;350:694–705. - PubMed
-
- Shapiro AM, Lakey JR, Ryan EA, et al. Islet transplantation in seven patients with type 1 diabetes mellitus using a glucocorticoid-free immunosuppressive regimen. N Engl J Med (USA) 2000;343:230–238. - PubMed
-
- McCulloch DK, Koerker DJ, Kahn SE, Bonner-Weir S, Palmer JP. Correlations of in vivo beta-cell function tests with beta-cell mass and pancreatic insulin content in streptozocin-administered baboons. Diabetes (USA) 1991;40:673–679. - PubMed
-
- Davalli AM, Ogawa Y, Scaglia L, et al. Function, mass, and replication of porcine and rat islets transplanted into diabetic nude mice. Diabetes (USA) 1995;44:104–111. - PubMed
-
- Davalli AM, Ogawa Y, Ricordi C, et al. A selective decrease in the beta cell mass of human islets transplanted into diabetic nude mice. Transplantation (USA) 1995;59:817–820. - PubMed
Publication types
MeSH terms
Substances
Grants and funding
- T35 DK007383/DK/NIDDK NIH HHS/United States
- R01 DK068751/DK/NIDDK NIH HHS/United States
- R21 DK062641/DK/NIDDK NIH HHS/United States
- U24 CA126588/CA/NCI NIH HHS/United States
- U01 DK089572/DK/NIDDK NIH HHS/United States
- R33 DK066636/DK/NIDDK NIH HHS/United States
- R01 DK069603/DK/NIDDK NIH HHS/United States
- R01 DK068764/DK/NIDDK NIH HHS/United States
- P60 DK020593/DK/NIDDK NIH HHS/United States
- T32 EB001628/EB/NIBIB NIH HHS/United States
- DK69603/DK/NIDDK NIH HHS/United States
- T35DK07383/DK/NIDDK NIH HHS/United States
- DK68764/DK/NIDDK NIH HHS/United States
- DK66636/DK/NIDDK NIH HHS/United States
- DK59637/DK/NIDDK NIH HHS/United States
- P30 DK020593/DK/NIDDK NIH HHS/United States
- DK20593/DK/NIDDK NIH HHS/United States
- DK63439/DK/NIDDK NIH HHS/United States
- DK068751/DK/NIDDK NIH HHS/United States
- T32EB001628/EB/NIBIB NIH HHS/United States
- DK62641/DK/NIDDK NIH HHS/United States
- R21 DK066636/DK/NIDDK NIH HHS/United States
- R21 DK063439/DK/NIDDK NIH HHS/United States
- U24 DK059637/DK/NIDDK NIH HHS/United States
LinkOut - more resources
Full Text Sources
Other Literature Sources
Medical
Molecular Biology Databases
Research Materials
