. 2009 Jun 30;106(26):10570-5.
doi: 10.1073/pnas.0900943106. Epub 2009 Jun 22.

The building blocks of economic complexity

Affiliations

The building blocks of economic complexity

César A Hidalgo et al. Proc Natl Acad Sci U S A. .

Abstract

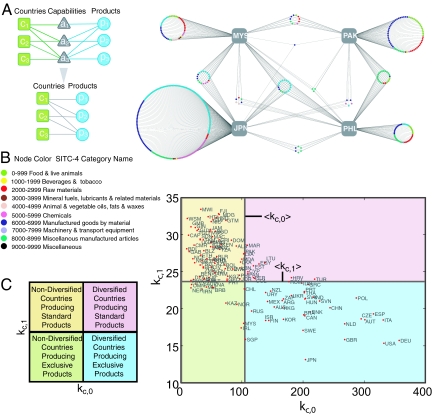
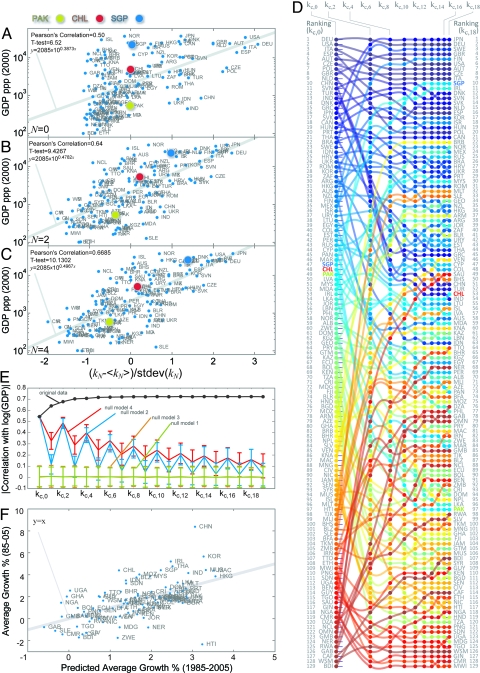
For Adam Smith, wealth was related to the division of labor. As people and firms specialize in different activities, economic efficiency increases, suggesting that development is associated with an increase in the number of individual activities and with the complexity that emerges from the interactions between them. Here we develop a view of economic growth and development that gives a central role to the complexity of a country's economy by interpreting trade data as a bipartite network in which countries are connected to the products they export, and show that it is possible to quantify the complexity of a country's economy by characterizing the structure of this network. Furthermore, we show that the measures of complexity we derive are correlated with a country's level of income, and that deviations from this relationship are predictive of future growth. This suggests that countries tend to converge to the level of income dictated by the complexity of their productive structures, indicating that development efforts should focus on generating the conditions that would allow complexity to emerge to generate sustained growth and prosperity.


Conflict of interest statement

The authors declare no conflict of interest.

Figures

Fig. 1.
Fig. 1.
Quantifying countries' economic complexity. (A) A country will be able to produce a product if it has all of the available capabilities, hence the bipartite network connecting countries to products is a result of the tripartite network connecting countries to their available capabilities and products to the capabilities they require. (B) Network visualization of a subset of Mcp in which we show Malaysia (MYS), Pakistan (PAK), Philippines (PHL), Japan (JPN), and all of the products exported by them in the year 2000 (colored circles), illustrating how countries and products are connected in Mcp. (C) kc,0kc,1 diagram divided into 4 quadrants defined by the empirically observed averages 〈kc,0〉 and 〈kc,1〉.
Fig. 2.
Fig. 2.
Capabilities and bipartite network structure. (A) We model the structure of Mcp by taking 2 random matrices representing the availability of capabilities in a country and the requirement of capabilities by products and consider that countries are able to produce products if they have all of the required capabilities. (B) The kc,0kc,1 diagrams that emerge from 4 implementations of the model described in A. (C) kc,0 and kc,1 as a function of the number of capabilities (Nc) available in countries for 2 implementations of the model. (D) Average number of labor inputs required by products produced in a country as a function of the first 3 components of k→c.
Fig. 3.
Fig. 3.
Bipartite network structure and income (all GDPs have been adjusted by Purchasing Power Parity PPP). A–E were constructed with data from the year 2000. (A–C) GDP per capita adjusted by purchasing power parity as a function of our first 3 measures of diversification (kc,0,kc,2,kc,4), normalized by subtracting their respective means (〈kc,N〉) and dividing them by their standard deviations (stdev(kc,N)). (A) kc,0. (B) kc,2. (C) kc,4. (D) Comparison between the ranking of countries based on successive measures of diversification (kc,2N) (E) Absolute value of the Pearson correlation between the log GDP per capita at ppp of countries and theit local network structure characterized by kc,N. (F) Growth in GDP per capita at ppp observed between 1985 and 2005 as a function of growth predicted from kc,18 and kc,19 measured in 1985 and controlling for GDP per capita at ppp in 1985.
Fig. 4.
Fig. 4.
Path dependent development. Average network properties (〈kp,0〉, 〈kp,1〉; measured in 1992) of the new exports developed by a country between 1992 and 2000 as a function of the diversification of a country kc,0 and the average ubiquity of its products kc,1 measured in 1992. (A) kc,0 vs. 〈kp,0〉. (B) kc,1 vs. 〈kp,0〉. (C) kc,0 vs. 〈kp,1〉. (D) kc,1 vs. 〈kp,1〉.

References

    1. Smith A. An Inquiry into the Nature and Causes of the Wealth of Nations. London: W. Strahan and T. Cadell; 1776.
    1. Romer P. Endogenous technological change. J Pol Econ. 1990;98:S71–S102.
    1. Grossman GM, Helpman E . Quality ladders in the theory of growth. Rev Econ Stud. 1991;58:43–61.
    1. Maddison A. The World Economy: A Millennial Perspective. Paris: Development Centre of the OECD; 2001.
    1. Pritchett L. Divergence, big time. J Econ Perspec. 1997;11:3–18.

Publication types