

Xenoestrogen-induced epigenetic repression of microRNA-9-3 in breast epithelial cells
- PMID: 19549897
- PMCID: PMC2855843
- DOI: 10.1158/0008-5472.CAN-08-4914
Xenoestrogen-induced epigenetic repression of microRNA-9-3 in breast epithelial cells
Abstract
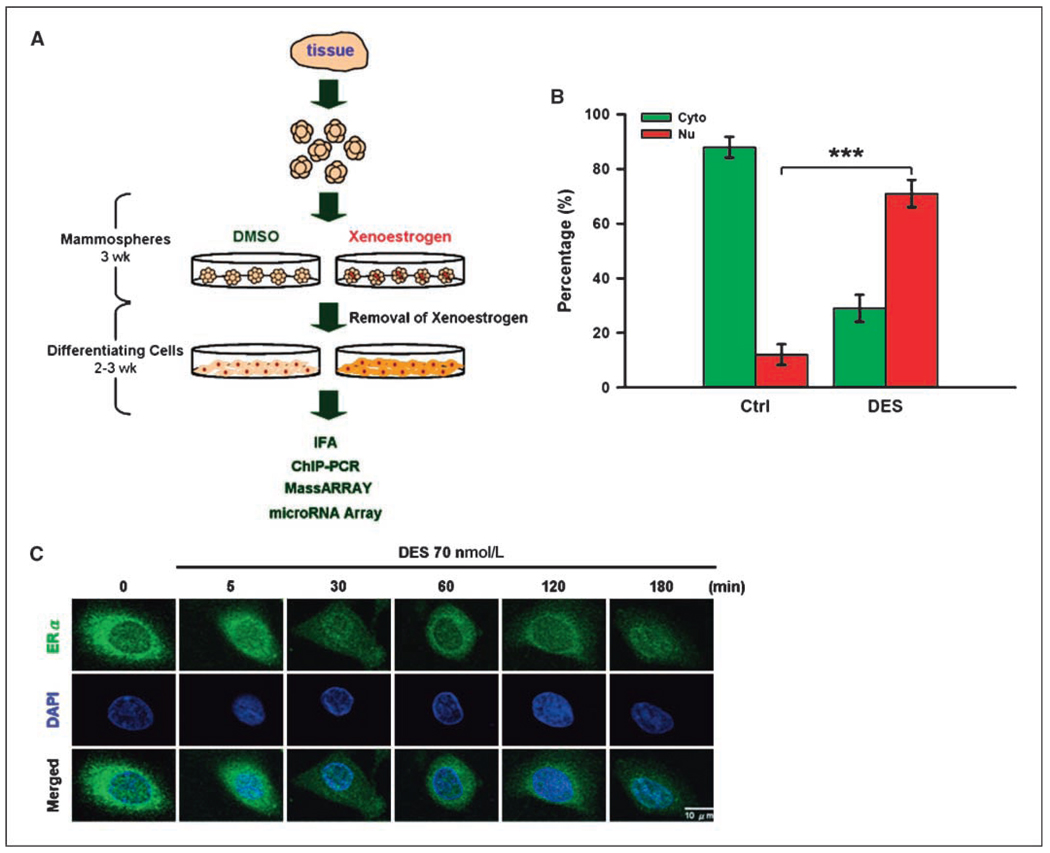
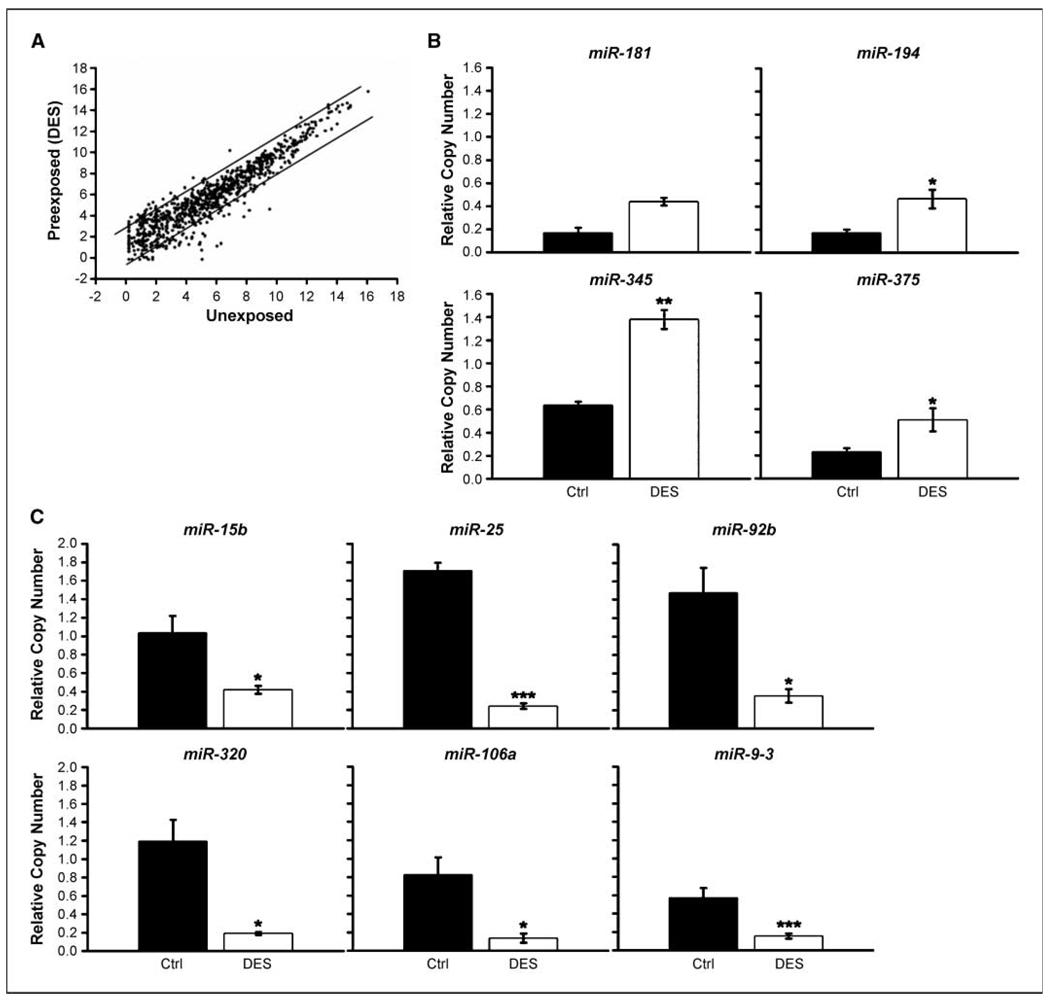
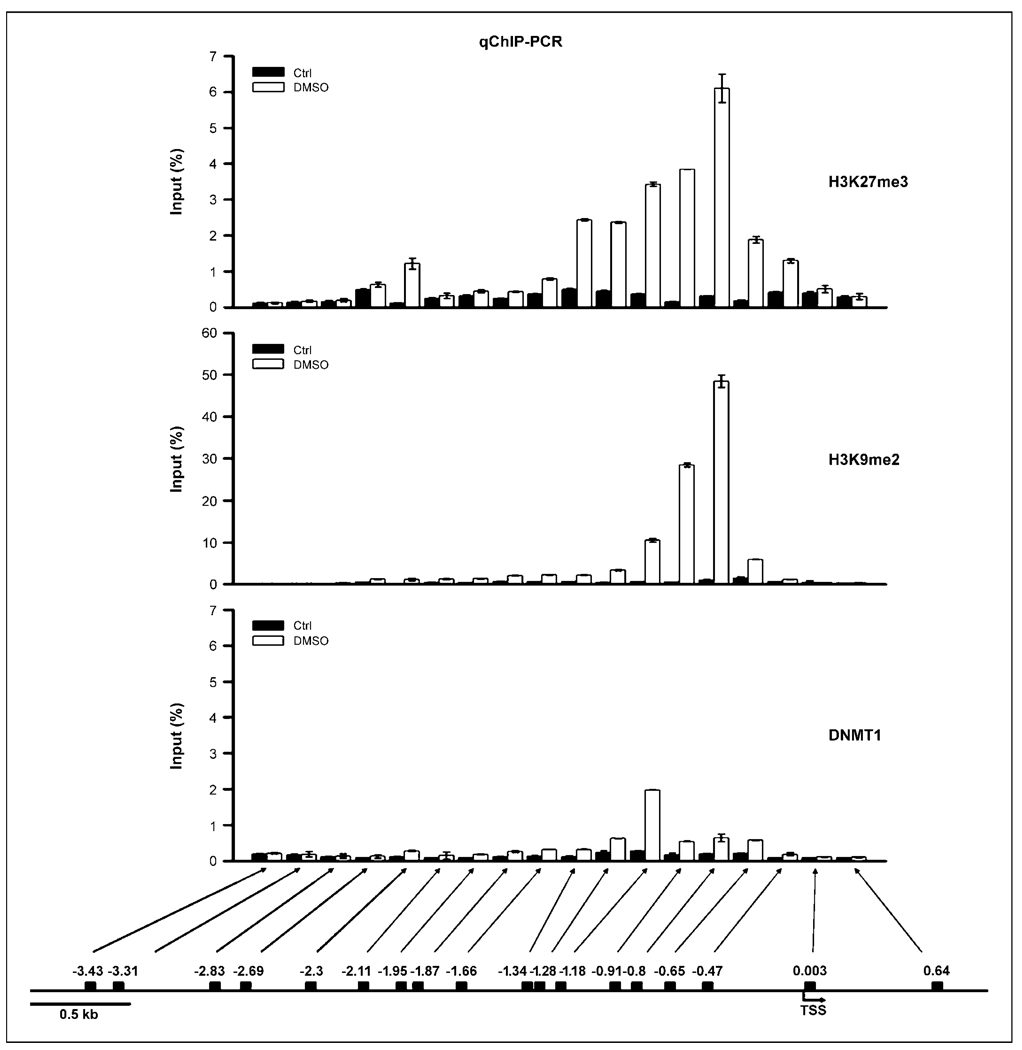
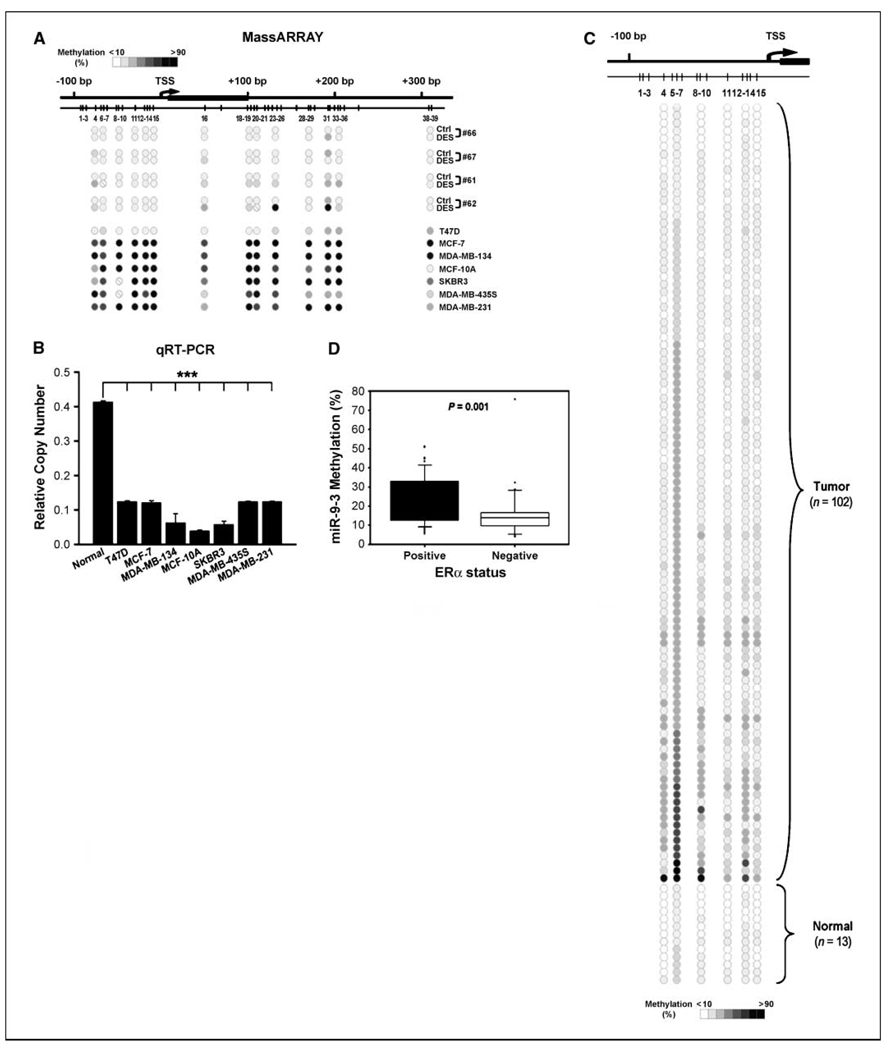
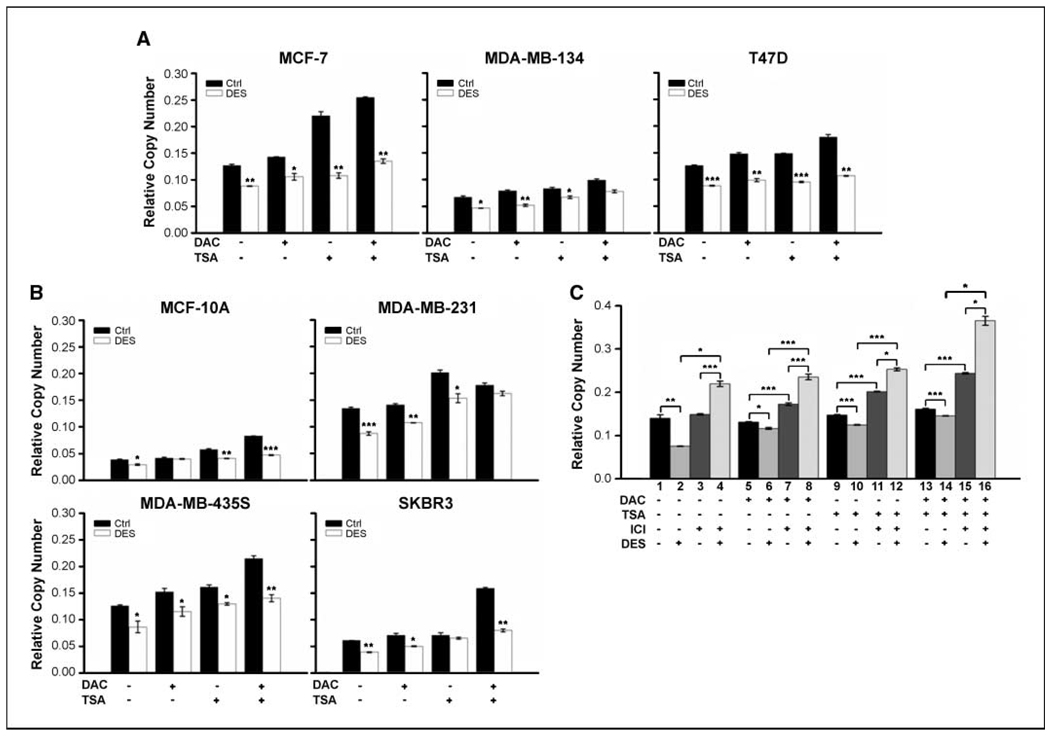
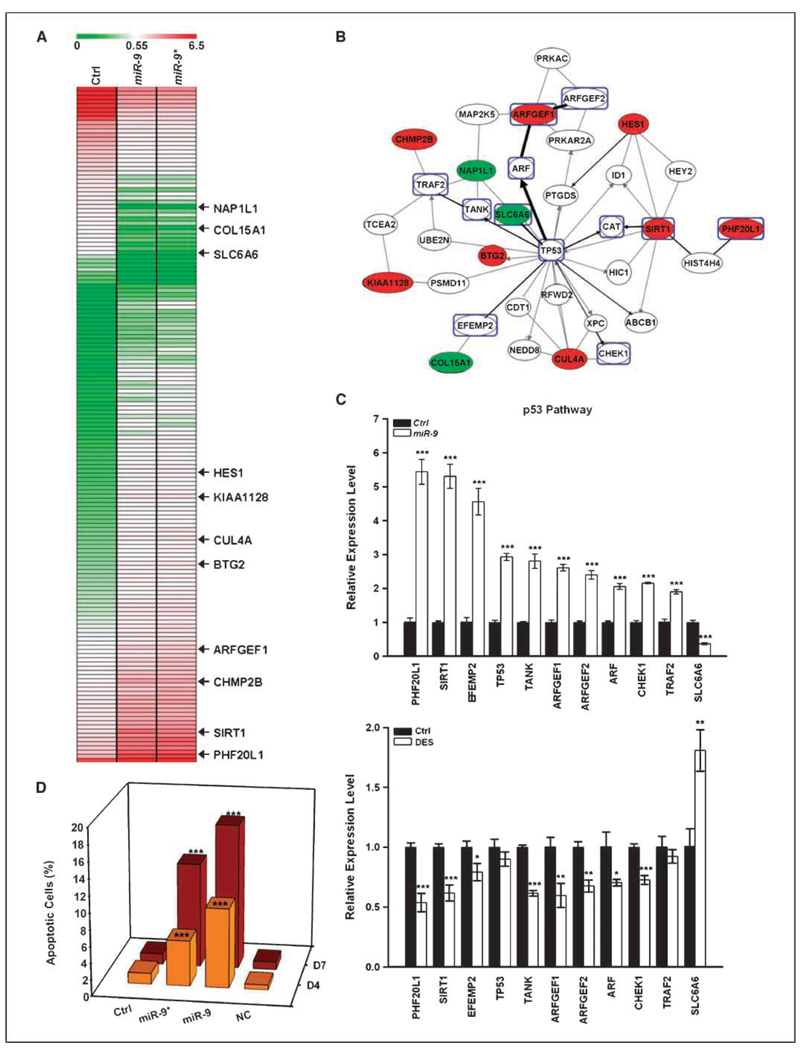
Early exposure to xenoestrogens may predispose to breast cancer risk later in adult life. It is likely that long-lived, self-regenerating epithelial progenitor cells are more susceptible to these exposure injuries over time and transmit the injured memory through epigenetic mechanisms to their differentiated progeny. Here, we used progenitor-containing mammospheres as an in vitro exposure model to study this epigenetic effect. Expression profiling identified that, relative to control cells, 9.1% of microRNAs (82 of 898 loci) were altered in epithelial progeny derived from mammospheres exposed to a synthetic estrogen, diethylstilbestrol. Repressive chromatin marks, trimethyl Lys27 of histone H3 (H3K27me3) and dimethyl Lys9 of histone H3 (H3K9me2), were found at a down-regulated locus, miR-9-3, in epithelial cells preexposed to diethylstilbestrol. This was accompanied by recruitment of DNA methyltransferase 1 that caused an aberrant increase in DNA methylation of its promoter CpG island in mammosphere-derived epithelial cells on diethylstilbestrol preexposure. Functional analyses suggest that miR-9-3 plays a role in the p53-related apoptotic pathway. Epigenetic silencing of this gene, therefore, reduces this cellular function and promotes the proliferation of breast cancer cells. Promoter hypermethylation of this microRNA may be a hallmark for early breast cancer development, and restoration of its expression by epigenetic and microRNA-based therapies is another viable option for future treatment of this disease.
Conflict of interest statement
No potential conflicts of interest were disclosed.
Figures
Similar articles
-
Methylation-mediated silencing of TMS1/ASC is accompanied by histone hypoacetylation and CpG island-localized changes in chromatin architecture.J Biol Chem. 2002 Feb 15;277(7):4951-8. doi: 10.1074/jbc.M109809200. Epub 2001 Dec 3. J Biol Chem. 2002. PMID: 11733524
-
Demethylation by 5-aza-2'-deoxycytidine in colorectal cancer cells targets genomic DNA whilst promoter CpG island methylation persists.BMC Cancer. 2010 Jul 12;10:366. doi: 10.1186/1471-2407-10-366. BMC Cancer. 2010. PMID: 20618997 Free PMC article.
-
Epigenetics and miRNA as predictive markers and targets for lung cancer chemotherapy.Cancer Biol Ther. 2015;16(7):1056-70. doi: 10.1080/15384047.2015.1046023. Cancer Biol Ther. 2015. PMID: 25962089 Free PMC article.
-
Epigenetic influences of low-dose bisphenol A in primary human breast epithelial cells.Toxicol Appl Pharmacol. 2010 Oct 15;248(2):111-21. doi: 10.1016/j.taap.2010.07.014. Epub 2010 Aug 1. Toxicol Appl Pharmacol. 2010. PMID: 20678512 Free PMC article.
-
Epigenetic silencing of TTF-1/NKX2-1 through DNA hypermethylation and histone H3 modulation in thyroid carcinomas.Lab Invest. 2009 Jul;89(7):791-9. doi: 10.1038/labinvest.2009.50. Epub 2009 Jun 8. Lab Invest. 2009. PMID: 19506552
Cited by
-
Endocrine-Disrupting Chemicals and Their Effects during Female Puberty: A Review of Current Evidence.Int J Mol Sci. 2020 Mar 18;21(6):2078. doi: 10.3390/ijms21062078. Int J Mol Sci. 2020. PMID: 32197344 Free PMC article. Review.
-
Non-coding RNAs as direct and indirect modulators of epigenetic regulation.Epigenetics. 2014 Jan;9(1):3-12. doi: 10.4161/epi.27473. Epigenetics. 2014. PMID: 24739571 Free PMC article. Review.
-
Crosstalk between miRNAs and DNA Methylation in Cancer.Genes (Basel). 2023 May 12;14(5):1075. doi: 10.3390/genes14051075. Genes (Basel). 2023. PMID: 37239435 Free PMC article. Review.
-
Gender-specific reduction of estrogen-sensitive small RNA, miR-30b, in subjects with schizophrenia.Schizophr Bull. 2012 May;38(3):433-43. doi: 10.1093/schbul/sbq091. Epub 2010 Aug 23. Schizophr Bull. 2012. PMID: 20732949 Free PMC article.
-
Environmental chemicals and microRNAs.Mutat Res. 2011 Sep 1;714(1-2):105-12. doi: 10.1016/j.mrfmmm.2011.05.004. Epub 2011 May 14. Mutat Res. 2011. PMID: 21609724 Free PMC article. Review.
References
-
- Fenton SE. Endocrine-disrupting compounds and mammary gland development: early and later life consequence. Endocrinology. 2006;147:S18–S24. - PubMed
-
- Yager JD, Davidson NE. Estrogen carcinogenesis in breast cancer. N Engl J Med. 2006;354:270–282. - PubMed
-
- Jensen EV, Jordan VC. The estrogen receptor: a model for molecular medicine. Clin Cancer Res. 2003;9:1980–1989. - PubMed
-
- McDonnell D, Norris J. Connections and regulation of the human estrogen receptor. Science. 2002;296:1642–1644. - PubMed
Publication types
MeSH terms
Substances
Grants and funding
LinkOut - more resources
Full Text Sources
Research Materials
Miscellaneous
