

Overexpression of DPAGT1 leads to aberrant N-glycosylation of E-cadherin and cellular discohesion in oral cancer
- PMID: 19549906
- PMCID: PMC2771190
- DOI: 10.1158/0008-5472.CAN-08-4512
Overexpression of DPAGT1 leads to aberrant N-glycosylation of E-cadherin and cellular discohesion in oral cancer
Abstract
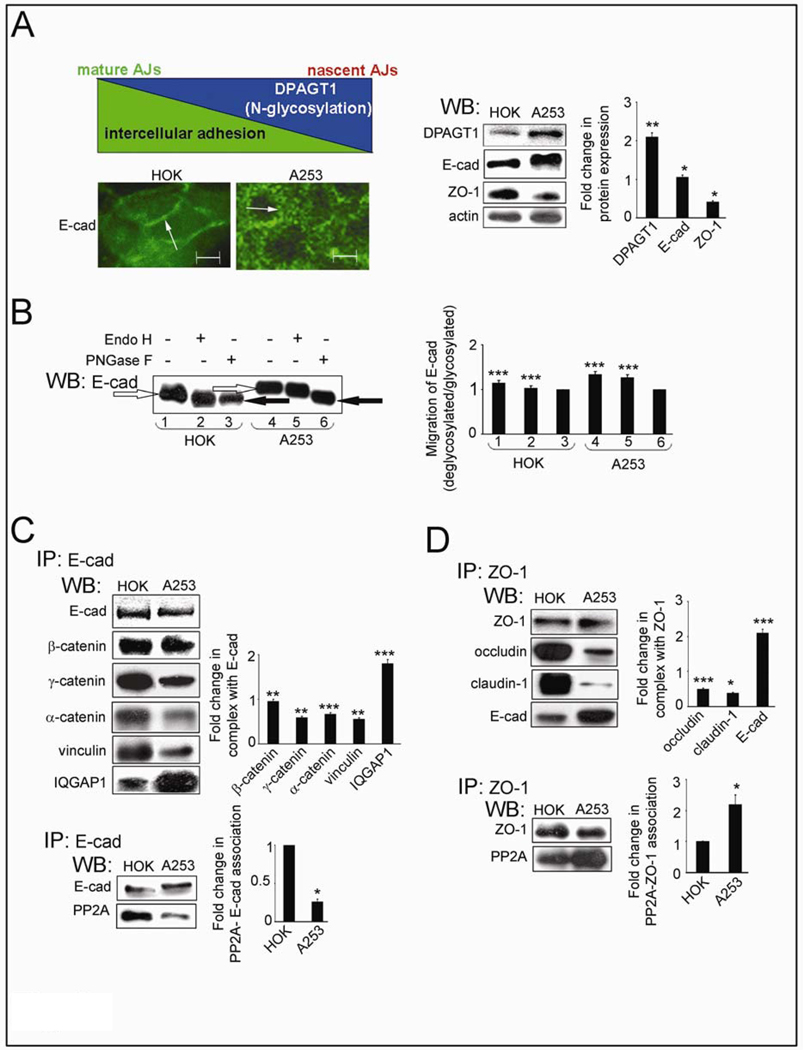
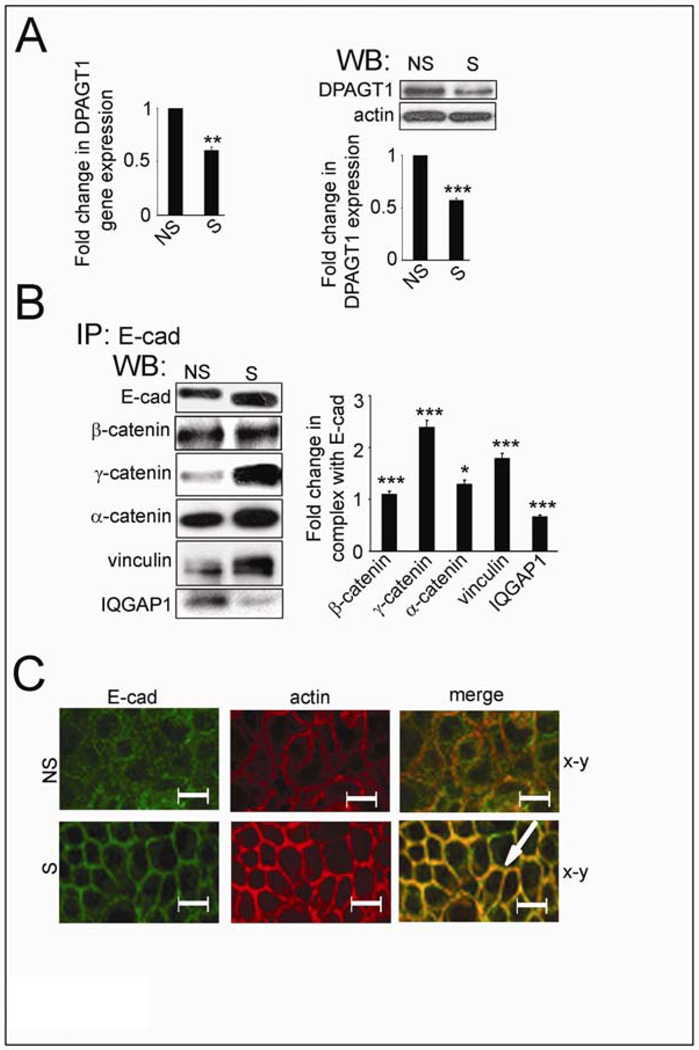
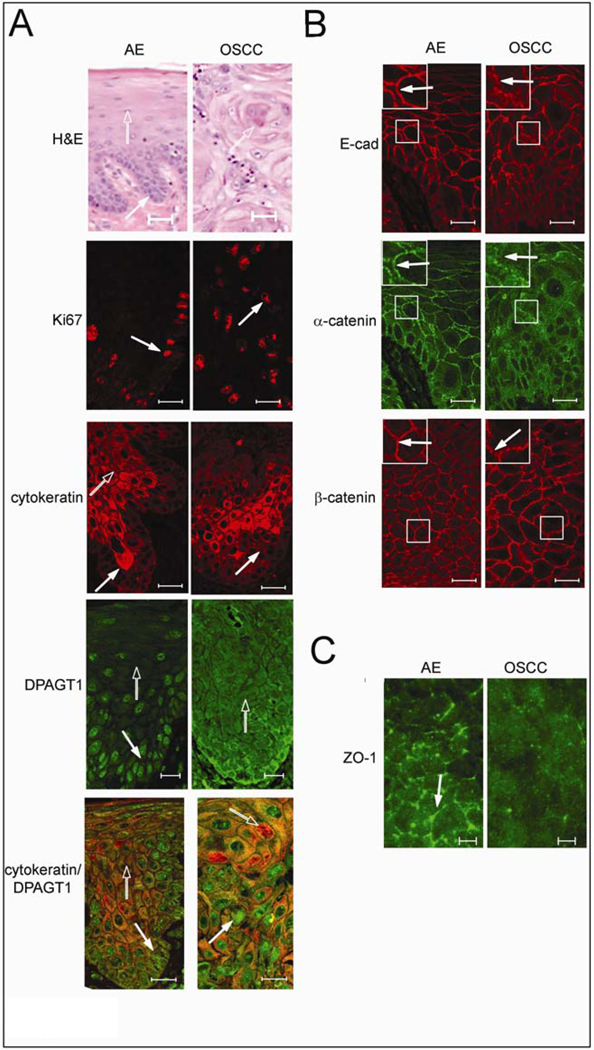
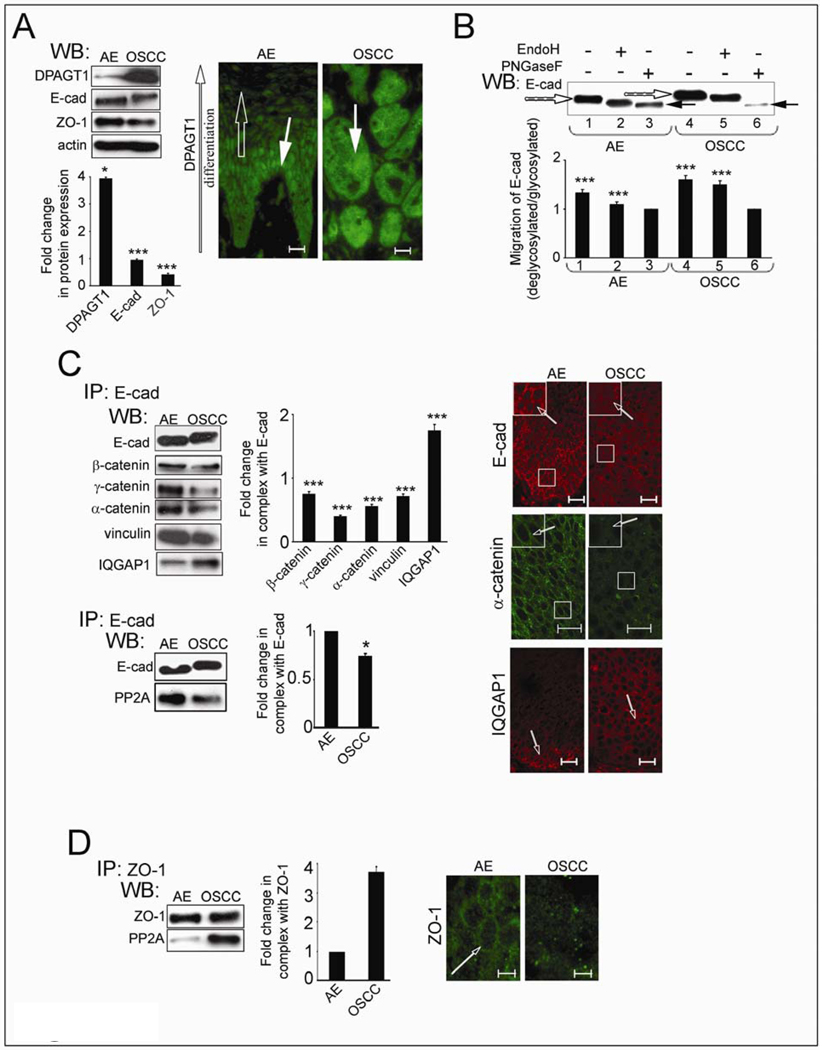
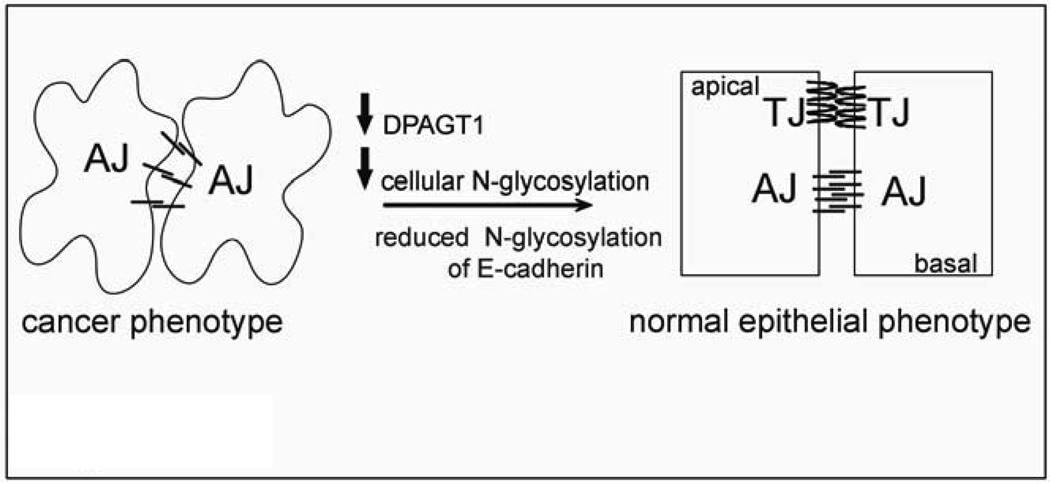
Cancer cells are frequently characterized by aberrant increases in protein N-glycosylation and by disruption of E-cadherin-mediated adherens junctions. The relationship between altered N-glycosylation and loss of E-cadherin adhesion in cancer, however, remains unclear. Previously, we reported that complex N-glycans on the extracellular domains of E-cadherin inhibited the formation of mature adherens junctions. Here, we examined whether dysregulated N-glycosylation was one of the underlying causes for cellular discohesion in oral cancer. We show that dense cultures of human salivary epidermoid carcinoma A253 cells exhibited elevated expression of DPAGT1, the gene that initiates protein N-glycosylation. Overexpression of DPAGT1 correlated with the production of E-cadherin-bearing complex N-glycans in nascent adherens junctions. Partial inhibition of DPAGT1 with small interfering RNA reduced the complex N-glycans of E-cadherin and increased the abundance of alpha-catenin and stabilizing proteins in adherens junctions. This was associated with the assembly of functional tight junctions. The inverse relationship between DPAGT1 expression and intercellular adhesion was a feature of oral squamous cell carcinoma. Oral squamous cell carcinomas displayed overexpression of DPAGT1 that correlated with diminished localization of E-cadherin and alpha-catenin at the sites of adherens junctions. Our studies show for the first time that DPAGT1 is an upstream regulator of E-cadherin N-glycosylation status and adherens junction composition and suggest that dysregulation of DPAGT1 causes disturbances in intercellular adhesion in oral cancer.
Figures
Similar articles
-
Coordinate regulation of N-glycosylation gene DPAGT1, canonical Wnt signaling and E-cadherin adhesion.J Cell Sci. 2013 Jan 15;126(Pt 2):484-96. doi: 10.1242/jcs.113035. Epub 2012 Nov 23. J Cell Sci. 2013. PMID: 23178939 Free PMC article.
-
Aberrant amplification of the crosstalk between canonical Wnt signaling and N-glycosylation gene DPAGT1 promotes oral cancer.Oral Oncol. 2012 Jun;48(6):523-9. doi: 10.1016/j.oraloncology.2012.01.010. Epub 2012 Feb 15. Oral Oncol. 2012. PMID: 22341307 Free PMC article.
-
Protein N-glycosylation in oral cancer: dysregulated cellular networks among DPAGT1, E-cadherin adhesion and canonical Wnt signaling.Glycobiology. 2014 Jul;24(7):579-91. doi: 10.1093/glycob/cwu031. Epub 2014 Apr 17. Glycobiology. 2014. PMID: 24742667 Free PMC article. Review.
-
N-glycosylation induces the CTHRC1 protein and drives oral cancer cell migration.J Biol Chem. 2013 Jul 12;288(28):20217-27. doi: 10.1074/jbc.M113.473785. Epub 2013 May 23. J Biol Chem. 2013. PMID: 23703614 Free PMC article.
-
Hypoglycosylated E-cadherin promotes the assembly of tight junctions through the recruitment of PP2A to adherens junctions.Exp Cell Res. 2010 Jul 1;316(11):1871-84. doi: 10.1016/j.yexcr.2010.02.008. Epub 2010 Feb 13. Exp Cell Res. 2010. PMID: 20156436 Free PMC article.
Cited by
-
Functional Specialization of Human Salivary Glands and Origins of Proteins Intrinsic to Human Saliva.Cell Rep. 2020 Nov 17;33(7):108402. doi: 10.1016/j.celrep.2020.108402. Cell Rep. 2020. PMID: 33207190 Free PMC article.
-
Results from a real-world study: a novel glycosyltransferase risk score for prognosis, tumor microenvironment phenotypes and immunotherapy in bladder cancer.BMC Cancer. 2024 Aug 2;24(1):947. doi: 10.1186/s12885-024-12712-w. BMC Cancer. 2024. PMID: 39095785 Free PMC article.
-
Coordinate regulation of N-glycosylation gene DPAGT1, canonical Wnt signaling and E-cadherin adhesion.J Cell Sci. 2013 Jan 15;126(Pt 2):484-96. doi: 10.1242/jcs.113035. Epub 2012 Nov 23. J Cell Sci. 2013. PMID: 23178939 Free PMC article.
-
A genome-wide CRISPR screen identifies DPM1 as a modifier of DPAGT1 deficiency and ER stress.PLoS Genet. 2022 Sep 27;18(9):e1010430. doi: 10.1371/journal.pgen.1010430. eCollection 2022 Sep. PLoS Genet. 2022. PMID: 36166480 Free PMC article.
-
Suppression of G6PD induces the expression and bisecting GlcNAc-branched N-glycosylation of E-Cadherin to block epithelial-mesenchymal transition and lymphatic metastasis.Br J Cancer. 2020 Oct;123(8):1315-1325. doi: 10.1038/s41416-020-1007-3. Epub 2020 Jul 28. Br J Cancer. 2020. PMID: 32719549 Free PMC article.
References
-
- Wheelock MJ, Johnson KR. Cadherins as modulators of cellular phenotype. Ann Rev Cell Dev Biol. 2003;19:207–235. - PubMed
-
- Gumbiner BM. Cell adhesion: the molecular basis of tissue architercture and morphogenesis. Cell. 1996;84:345–357. - PubMed
-
- Jamora C, Fuchs E. Intercellular adhesion, signalling and the cytoskeleton. Nat Cell Biol. 2002;4:101–108. - PubMed
-
- Chen H, Paradies NE, Fedor-Chaliken M, Brackenbury R. E-cadherin mediates adhesion and suppresses cell motility via distinct mechanisms. J Cell Sci. 1997;110:345–356. - PubMed
Publication types
MeSH terms
Substances
Grants and funding
LinkOut - more resources
Full Text Sources
Other Literature Sources
Medical
Molecular Biology Databases
