. 2009 Jun 24:10:279.
doi: 10.1186/1471-2164-10-279.

Transcriptional profiling in response to terminal drought stress reveals differential responses along the wheat genome

Affiliations

Transcriptional profiling in response to terminal drought stress reveals differential responses along the wheat genome

Alessio Aprile et al. BMC Genomics. .

Abstract

Background: Water stress during grain filling has a marked effect on grain yield, leading to a reduced endosperm cell number and thus sink capacity to accumulate dry matter. The bread wheat cultivar Chinese Spring (CS), a Chinese Spring terminal deletion line (CS_5AL-10) and the durum wheat cultivar Creso were subjected to transcriptional profiling after exposure to mild and severe drought stress at the grain filling stage to find evidences of differential stress responses associated to different wheat genome regions.

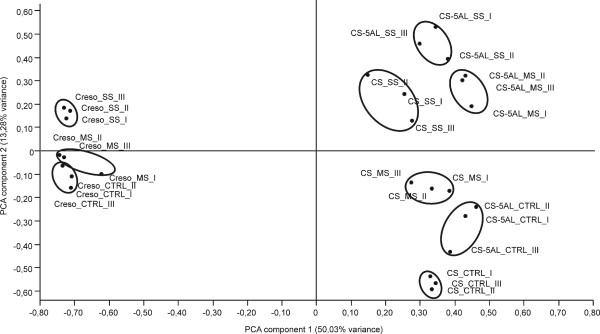
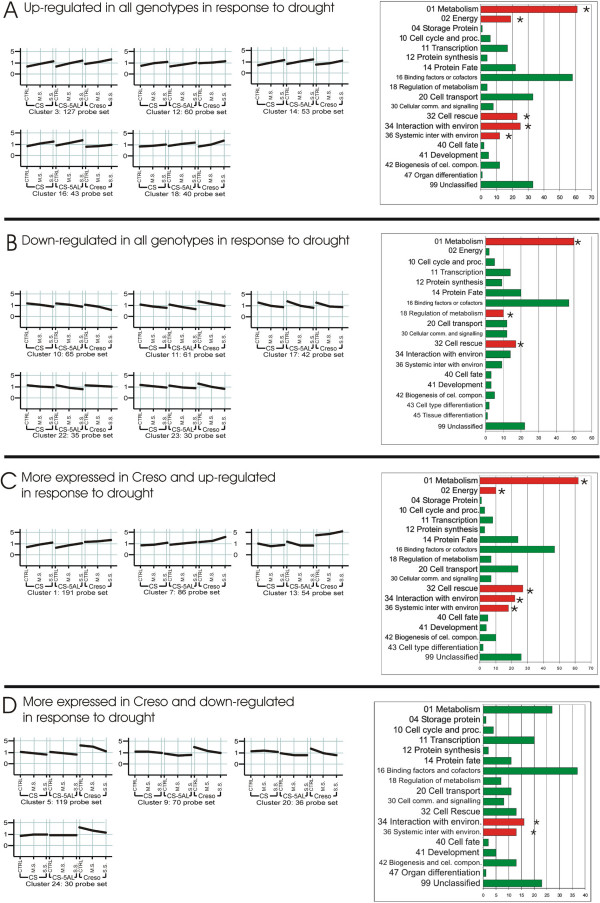
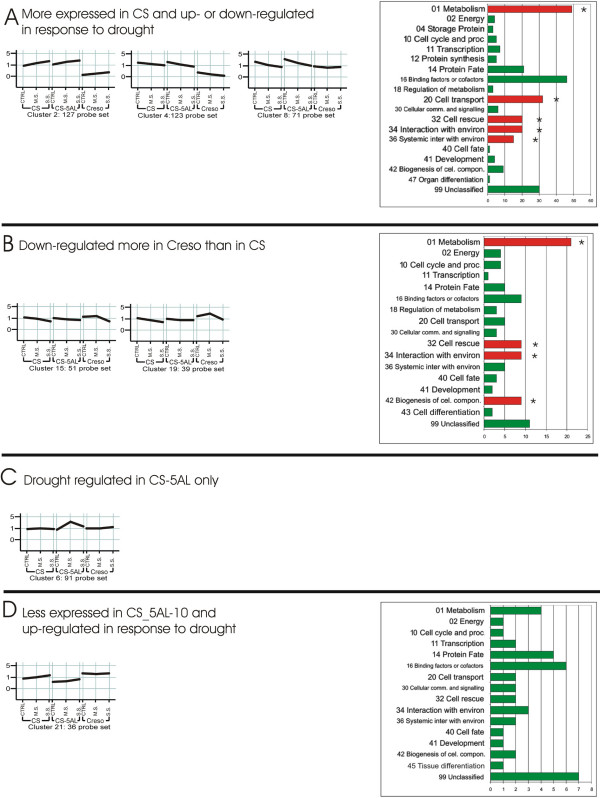
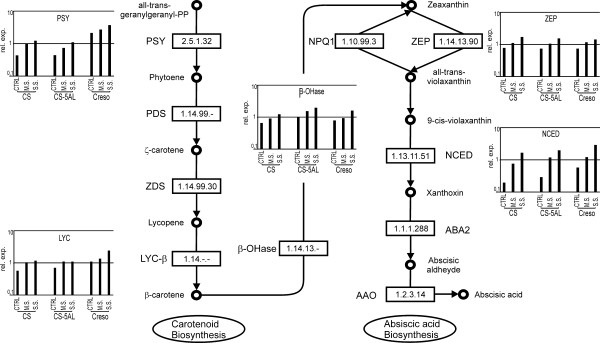
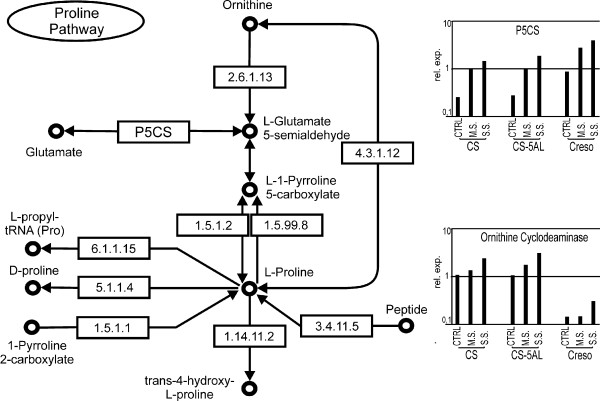
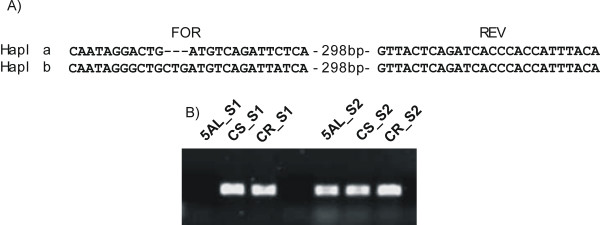
Results: The transcriptome analysis of Creso, CS and its deletion line revealed 8,552 non redundant probe sets with different expression levels, mainly due to the comparisons between the two species. The drought treatments modified the expression of 3,056 probe sets. Besides a set of genes showing a similar drought response in Creso and CS, cluster analysis revealed several drought response features that can be associated to the different genomic structure of Creso, CS and CS_5AL-10. Some drought-related genes were expressed at lower level (or not expressed) in Creso (which lacks the D genome) or in the CS_5AL-10 deletion line compared to CS. The chromosome location of a set of these genes was confirmed by PCR-based mapping on the D genome (or the 5AL-10 region). Many clusters were characterized by different level of expression in Creso, CS and CS_AL-10, suggesting that the different genome organization of the three genotypes may affect plant adaptation to stress. Clusters with similar expression trend were grouped and functional classified to mine the biological mean of their activation or repression. Genes involved in ABA, proline, glycine-betaine and sorbitol pathways were found up-regulated by drought stress. Furthermore, the enhanced expression of a set of transposons and retrotransposons was detected in CS_5AL-10.

Conclusion: Bread and durum wheat genotypes were characterized by a different physiological reaction to water stress and by a substantially different molecular response. The genome organization accounted for differences in the expression level of hundreds of genes located on the D genome or controlled by regulators located on the D genome. When a genomic stress (deletion of a chromosomal region) was combined with low water availability, a molecular response based on the activation of transposons and retrotransposons was observed.


Figures

Figure 1
Figure 1
PCA plot of the wheat array hybridization data. The x and y axis represent the two principal components of the total variance, 50.03% and 13.28%, respectively. Each oval groups samples from the same genotype and treatment. CTRL = Control samples, MS = Moderate stress samples, SS = Severe stress samples.
Figure 2
Figure 2
Representation of 17 out of 24 QT-clusters obtained using the expression values of the 3,056 stress-related genes differentially expressed in at least one condition/genotype. The cluster analyses was performed with a minimum cluster size of 30 and a correlation value of 0.75. The three treatments, grouped by genotypes, are plotted on x axis. The relative expression level (data normalized to the median for each probe set) is plotted on the y axis. The horizontal lines represent the average expression of all probe sets belonging to each cluster. 1,376 probe sets didn't fit the QT-clustering parameters.
Figure 3
Figure 3
Representation of 7 out of 24 QT-clusters obtained using the expression values of the 3,056 stress-related genes differentially expressed in at least one condition/genotype. The cluster analyses was performed with a minimum cluster size of 30 and a correlation value of 0.75. The three treatments, grouped by genotypes, are plotted on x axis. The relative expression level (data normalized to the median for each probe set) is plotted on the y axis. The horizontal lines represent the average expression of all probe sets belonging to each cluster. 1,376 probe sets didn't fit the QT-clustering parameters.
Figure 4
Figure 4
Brief overview of the ABA pathway (inferred by KEGG, [45]). On the left side the β-carotene biosynthesis steps. On the right the ABA-dedicated enzymatic reactions. Several probe sets related to ABA synthesis enzymes (PSY, LYC- β, β-OHase, NCED) were up-regulated by drought stress. Their expression levels based on array data are showed in the corresponding histograms. 2.5.1.32 = Phytoene synthase (PSY); 1.14.99.-= Phytoene desaturase (PDS); 1.14.99.30 = ζ-carotene desaturase (ZDS); 1.14.-.-= Lycopene β-cyclase (LYC-β); 1.14.13.- = β-carotene hydroxylase (β-OHase); 1.10.99.3 = Violaxanthin de-epoxidase (NPQ1); 1.14.13.90 = Zeaxanthin epoxidase (ZEP); 1.13.11.51 = 9-cis-epoxycarotenoid dioxygenase (NCED); 1.1.1.288 = xanthoxin dehydrogenase (ABA2); 1.2.3.14 = Abscisic aldehyde oxidase (AAO).
Figure 5
Figure 5
Overview of proline biosynthesis and main catabolic reactions (inferred by KEGG, [45]). Only the P5CS and ornithine cyclodeaminase probe sets were found to be differentially expressed. The expression levels based on array data are showed in the corresponding histograms. 2.6.1.13 = ornithine aminotransferase; P5CS = Δ-pyrroline-5-carboxylate synthase; 4.3.1.12 = ornithine cyclodeaminase; 1.5.1.2 = Δ-pyrroline-5-carboxylate reductase; 1.5.99.8 = proline dehydrogenase; 6.1.1.15 = prolyl-tRNA synthase; 5.1.1.4 = proline racemase; 1.14.11.2 = prolyl hydroxylase; 3.4.11.5 = proline iminopeptidase; 1.5.1.1 = pyrroline-2-carboxylate reductase.
Figure 6
Figure 6
PCR-mapping of genes putatively located on the 5AL-10 deleted region. The example reported refers to the sequence corresponding to probe set Ta.9404.1.A1_at. The sequence is moderately similar to a rice kinase (Os03g0107400). A) Alignment between the sequence used to design the probe set (Hapl a) and a homoeologous gene (Hapl b). Sequences used to design the primers are highlighted. The forward (FOR) primer is haplotype-specific, while the reverse (REV) primer is common. B) PCR reaction performed using the primers shown in A). Since the primer pair for Hapl a amplified the target sequence in both CS and Creso and no amplicon was observed in CS-5AL-10, the haplotype ''a'' correspond to a sequence located on to the 5AL-10 deleted region. 5AL: CS-5AL-10 deletion line. CS: Chinese Spring. CR: Creso; S1: Haplotype 1 – specific primers; S2: Haplotype 2 – specific primers.

References

    1. Rizhsky L, Liang H, Mittler R. The combined effect of drought stress and heat shock on gene expression in tobacco. Plant Physiol. 2002;130:1143–1151. doi: 10.1104/pp.006858. - DOI - PMC - PubMed
    1. Bartels D, Sunkar R. Drought and salt tolerance in plants. Crit Rev Plant Sci. 2005;24:23–58. doi: 10.1080/07352680590910410. - DOI
    1. Seki M, Umezawa T, Urano K, Shinozaki K. Regulatory metabolic networks in drought stress responses. Curr Opin Plant Biol. 2007;10:296–302. doi: 10.1016/j.pbi.2007.04.014. - DOI - PubMed
    1. Yamaguchi-Shinozaki K, Shinozaki K. Organization of -acting regulatory elements in osmotic- and cold-stress-responsive promoters. Trends Plant Sci. 2005;10:88–94. doi: 10.1016/j.tplants.2004.12.012. - DOI - PubMed
    1. Uno Y, Furihata T, Abe H, Yoshida R, Shinozaki K, Yamaguchi-Shinozaki K. Arabidopsis basic leucine zipper transcription factors involved in an abscisic acid-dependent signal transduction pathway under drought and high-salinity conditions. P Natl Acad Sci USA. 2000;97:11632–11637. doi: 10.1073/pnas.190309197. - DOI - PMC - PubMed

Publication types