. 2009 Jun 24:10:280.
doi: 10.1186/1471-2164-10-280.

Impact of animal strain on gene expression in a rat model of acute cardiac rejection

Affiliations

Impact of animal strain on gene expression in a rat model of acute cardiac rejection

Katherine J Deans et al. BMC Genomics. .

Abstract

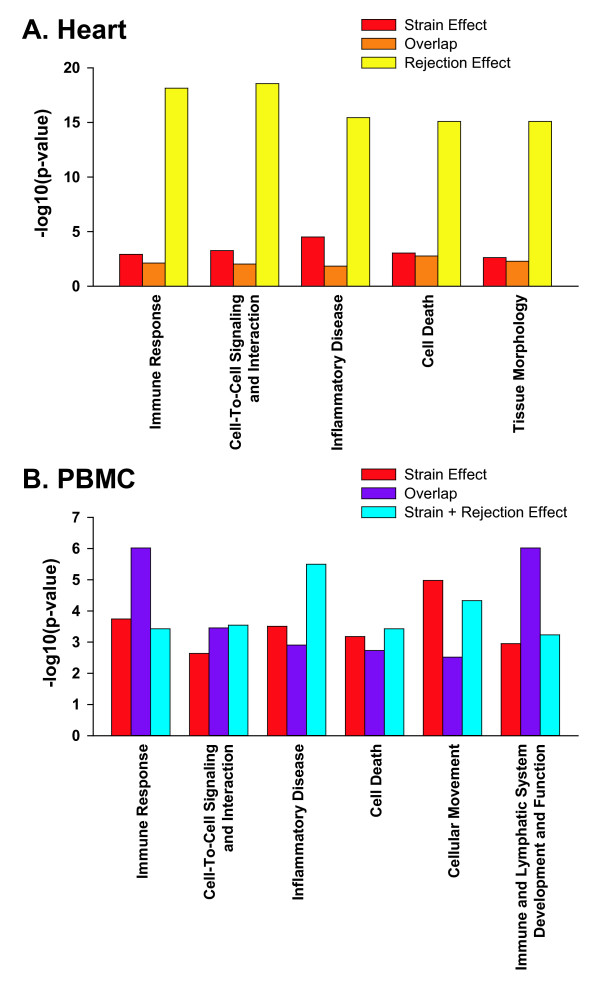
Background: The expression levels of many genes show wide natural variation among strains or populations. This study investigated the potential for animal strain-related genotypic differences to confound gene expression profiles in acute cellular rejection (ACR). Using a rat heart transplant model and 2 different rat strains (Dark Agouti, and Brown Norway), microarrays were performed on native hearts, transplanted hearts, and peripheral blood mononuclear cells (PBMC).

Results: In heart tissue, strain alone affected the expression of only 33 probesets while rejection affected the expression of 1368 probesets (FDR 10% and FC > o= 3). Only 13 genes were affected by both strain and rejection, which was < 1% (13/1368) of all probesets differentially expressed in ACR. However, for PBMC, strain alone affected 265 probesets (FDR 10% and FC > or = 3) and the addition of ACR had little further effect. Pathway analysis of these differentially expressed strain effect genes connected them with immune response, cell motility and cell death, functional themes that overlap with those related to ACR. After accounting for animal strain, additional analysis identified 30 PBMC candidate genes potentially associated with ACR.

Conclusion: In ACR, genetic background has a large impact on the transcriptome of immune cells, but not heart tissue. Gene expression studies of ACR should avoid study designs that require cross strain comparisons between leukocytes.


Figures

Figure 1
Figure 1
Experimental groups and specimen procurement. (A) Isogeneic transplants consisted of a strain DA donor heart placed into the abdomen of a strain DA recipient rat. Specimens procured from isogeneic transplants consisted of strain DA isograft and native heart, and strain DA blood.(B) Allogeneic transplants consisted of a strain DA donor heart placed into the abdomen of a strain BN recipient rat. Specimens procured from allogeneic transplants consisted of strain DA allograft and strain BN native heart, and strain BN blood. (C) Untransplanted animals were strain DA and BN rats that did not receive an isograft or an allograft heart. Specimens procured from untransplanted animals consisted of strain DA and strain BN blood.
Figure 2
Figure 2
Principal component (PC) analysis. (A) Depicts variability in gene expression of native hearts from allograft (BN) and isograft recipients (DA), and of transplanted hearts from allograft (DA) and isograft recipients (DA). Principal component 1 (PC1) on the x-axis, and PC2 on the y-axis, accounted for 42.5% (p < 0.05), and 7.9% of total variability in gene expression, respectively. The samples visually separate into 3 main groups based on their immunological status: (1) rejecting transplanted hearts from allograft recipient (DA allograft); (2) non-rejecting transplanted hearts from isograft recipient (DA isograft); (3) and native hearts (DA and BN). (B) Depicts variability in gene expression of peripheral blood mononuclear cells (PBMC) from transplanted and untransplanted animals. Transplanted and untransplanted animal samples were processed in two batches, and the results as shown were batch-corrected for this nuisance factor. PC1 (x-axis) and PC2 (y-axis) accounted for 17% (p < 0.05) and 8% of the total variability in gene expression, respectively. Samples visually separate into 2 main groups: (1) PBMC from untransplanted DA animals and isograft recipients (DA); and (2) PBMC from untransplanted BN animals and allograft recipients (BN). The separation of animals primarily into two groups based on strain, and not ACR, indicates that most of the gene expression variability in PBMC during rejection was due to strain.
Figure 3
Figure 3
Venn diagram representation of the union of probeset lists. (A) Depicts the union of the probeset list for strain effect (native hearts) and the probeset list for rejection effect (transplanted hearts) in heart tissue. Of the 13 overlapping probesets (13 unique genes), the direction of gene expression change was concordant for 11. (B) Depicts the union of the probeset list for strain effect (untransplanted animals) and the probeset list for strain + rejection effect (transplanted animals) in PBMC. Of 120 overlapping probesets, the direction of gene expression change was concordant for 119. Figures 5 and 7 are color coded as defined by these Venn diagrams.
Figure 4
Figure 4
Validation of microarray results for genes similarly affected by strain irrespective of acute cardiac rejection. Two inflammatory response genes, Ccl9 and Itgal, were selected from the peripheral blood mononuclear cell (PBMC) overlap category shown in Figure 3B. Microarray and qRT-PCR results are from the same animals. (A) Strain effect in PBMC shown as the fold change in gene expression comparing untransplanted BN and DA rats. (B) Strain plus rejection effects in PBMC shown as the fold change in gene expression comparing allogeneic transplant recipients (BN) and isogeneic transplant recipients (DA). Ccl9 expression was higher and Itgal was lower in BN compared to DA animals irrespective of transplant status across both platforms.
Figure 5
Figure 5
Bivariate plots and heat maps of differentially expressed probesets. (A) Relative gene expression in native (strain effect) and transplanted hearts (rejection effect) are plotted on the x and y-axes, respectively in a base 10 log scale. Each circle represents one probeset. Probesets are colored to depict group membership as defined by the Venn diagram shown in Figure 3A. Strain and rejection effects are not highly correlated (R = 0.26). Differences in gene expression due to rejection are minimally confounded by differences in gene expression due to strain in heart tissue. In the heat map, red indicates over-expression and green indicates under-expression. From the heat map, it is visually evident that strain and rejection have dissimilar gene expression patterns. (B) Relative gene expression in the PBMC of untransplanted (strain effect) and transplanted (strain + rejection effect) animals are plotted on the x and y-axes, respectively, in a base 10 log scale. Each circle represents one probeset. Probesets are colored to depict group membership as defined by the Venn diagram shown in Figure 3B. Strain effects in both the absence and presence of rejection are highly correlated (R = 0.84). Differences in gene expression during rejection are unapparent compared to the large background differences attributable to animal strain. In the heat map, red indicates over-expression and green indicates under-expression. From the heat map it is visually evident that strain in the absence or presence of rejection is the predominant gene expression pattern. For both (A) and (B), certain probesets appear near each other but are placed in different categories as indicated by color coding. The categorization of probesets was based on the contribution of additional variables not apparent in these scatter plots (see Methods).
Figure 6
Figure 6
Hierarchical clustering of the union of the probeset lists. Two-way hierarchical clustering of samples and differentially expressed probesets within (A) heart tissue from native and transplanted hearts from isogeneic (i) and allogeneic (a) transplants; and (B) peripheral blood mononuclear cells (PBMC) from untransplanted animals and isogeneic and allogeneic transplants. Rows represent microarray chips and columns represent probesets. Red indicates over-expression and green indicates under-expression. The dendrogram illustrates how the samples segregate into groups. For heart tissue, samples segregate mainly based on the presence and absence of rejection. For PBMC, samples segregate mainly based on strain irrespective of rejection or transplant status.
Figure 7
Figure 7
Thematic analysis of differentially expressed genes. (A) Pathway analysis in heart tissue of differentially expressed genes associated with strain effect, or rejection effect or overlap region. (B) Pathway analysis of differentially expressed genes in peripheral blood mononuclear cells (PBMC) associated with strain alone or strain plus rejection or both (overlap region). Genes tested are grouped and color coded as defined by the Venn diagrams shown in Figure 3. For each graph, the threshold for significance is 1.3 representing – log 0.05 (unadjusted p = 0.05). In heart tissue, the over-represented functional categories such as immune response and cell death were more strongly associated with rejection than with the strain effect. Conversely in PBMC, strain effect was strongly linked to pathways indicative of immune response and cell death both in the presence and absence of rejection. Results based on an Ingenuity® Systems Pathway Analysis (see Methods).
Figure 8
Figure 8
Validation of microarray results for genes showing a rejection effect independent of animal strain. Two genes, S100a9 and Gzmb, induced by rejection (Table 1), and 2 genes, Prss1 and Lgals5, suppressed by rejection (Table 2) in peripheral blood mononuclear cells (PBMC) were selected for qRT-PCR. Microarray and qRT-PCR are from the same animals. The rejection effect in PBMC was defined as the strain plus rejection effect divided by the strain effect. Rejection effects on these 4 genes as measured by microarray and qRT-PCR were concordant.
Figure 9
Figure 9
Thematic analysis of candidate genes associated with rejection in peripheral blood mononuclear cells (PBMC). Pathway analysis of genes differentially expressed in PBMC in response to acute cardiac rejection (Table 1 and 2) after accounting for strain effects. Red indicates over-expression and green indicates under-expression. Results based on an Ingenuity® Systems Pathway Analysis.

References

    1. Kirklin JK, Naftel DC, Kirklin JW, Blackstone EH. Risk factors for death and related events after cardiac transplantation. Adv Cardiol. 1988;36:278–292. - PubMed
    1. Kirklin JK, Naftel DC, McGiffin DC, McVay RF, Blackstone EH, Karp RB. Analysis of morbid events and risk factors for death after cardiac transplantation. J Am Coll Cardiol. 1988;11:917–924. - PubMed
    1. Miller LW, Schlant RC, Kobashigawa J, Kubo S, Renlund DG. 24th Bethesda conference: Cardiac transplantation. Task Force 5: Complications. J Am Coll Cardiol. 1993;22:41–54. - PubMed
    1. Grossi P, De Maria R, Caroli A, Zaina MS, Minoli L. Infections in heart transplant recipients: the experience of the Italian heart transplantation program. Italian Study Group on Infections in Heart Transplantation. J Heart Lung Transplant. 1992;11:847–866. - PubMed
    1. Kemkes BM, Schutz A, Engelhardt M, Brandl U, Breuer M. Noninvasive methods of rejection diagnosis after heart transplantation. J Heart Lung Transplant. 1992;11:S221–231. - PubMed