. 2009 Jun 30;106(26):10505-10.
doi: 10.1073/pnas.0812152106. Epub 2009 Jun 24.

Global distribution of conformational states derived from redundant models in the PDB points to non-uniqueness of the protein structure

Affiliations

Global distribution of conformational states derived from redundant models in the PDB points to non-uniqueness of the protein structure

Prasad V Burra et al. Proc Natl Acad Sci U S A. .

Erratum in

  • Proc Natl Acad Sci U S A. 2009 Jul 28;106(30):12560

Abstract

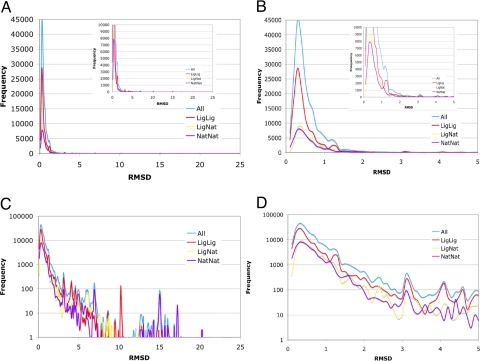
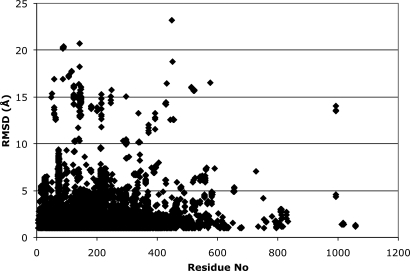
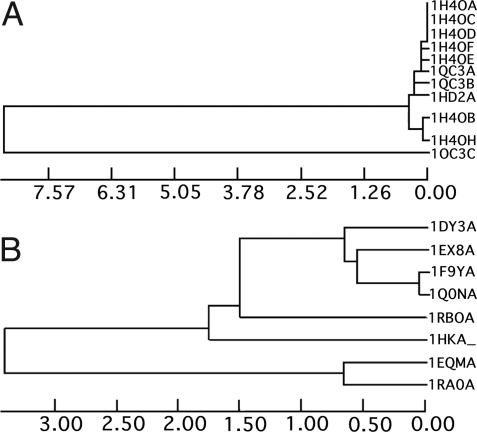
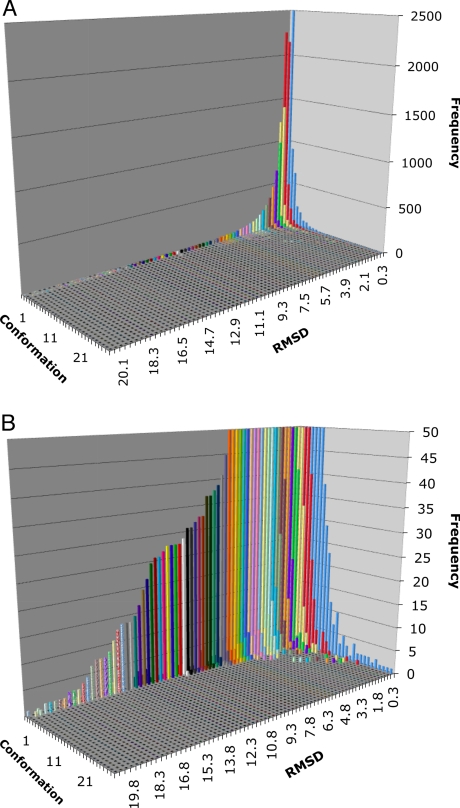
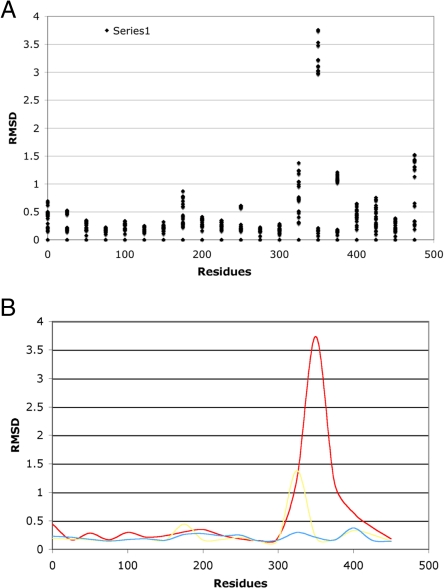
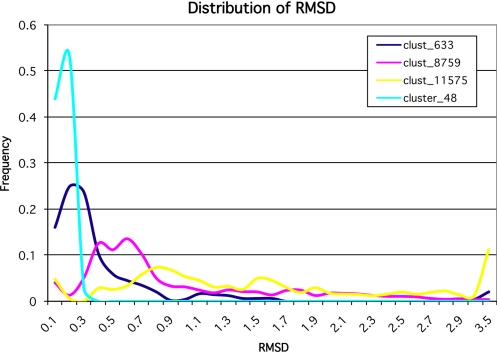
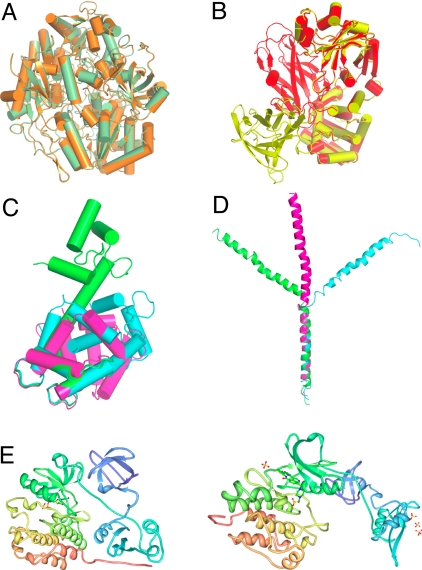
It is commonly accepted that proteins have evolutionarily conserved 3-dimensional structures, uniquely defined by their amino acid sequence. Here, we question the direct association of structure to sequence by comparing multiple models of identical proteins. Rapidly growing structural databases contain models of proteins determined independently multiple times. We have collected these models in the database of the redundant sets of protein structures and then derived their conformational states by clustering the models with low root-mean-square deviations (RMSDs). The distribution of conformational states represented in these sets is wider than commonly believed, in fact exceeding the possible range of structure determination errors, by at least an order of magnitude. We argue that differences among the models represent the natural distribution of conformational states. Our results suggest that we should change the common notion of a protein structure by augmenting a single 3-dimensional model by the width of the ensemble distribution. This width must become an indispensible attribute of the protein description. We show that every protein contains regions of high rigidity (solid-like) and regions of high mobility (liquid-like) in different and characteristic contribution. We also show that the extent of local flexibility is correlated with the functional class of the protein. This study suggests that the protein-folding problem has no unique solution and should be limited to defining the folding class of the solid-like fragments even though they may constitute only a small part of the protein. These results limit the capability of modeling protein structures with multiple conformational states.


Conflict of interest statement

The authors declare no conflict of interest.

Figures

Fig. 1.
Fig. 1.
Global distributions of pair-wise RMSDs combined for all of the clusters. The distribution is wide and maximum reaches 23.7 Å. Panels A and C show the distributions within the maximal range of 24 Å and panels B and D within 5 Å RMSD. The blue line represents all-to-all RMSDs, red line ligand-ligand, yellow line ligand-native RMSDs, and dark-blue line native-native RMSDs distribution. Insets show the smaller frequency scale to show similarity of the different distributions regardless of the scale. Panels C and D show the same plots as in A and B with frequency in logarithmic scale.
Fig. 2.
Fig. 2.
Plot of the RMSDs versus the length of the protein sequence.
Fig. 3.
Fig. 3.
Example of trees of conformational states obtained by subclustering the RMSDs in individual cluster.
Fig. 4.
Fig. 4.
Global distribution of the conformational states of all clusters obtained by subclustering the RMSDs in individual cluster. A single bar represents the number of clusters with the given number of subcluster (conformational states) in reference to the RMSD cutoff at which the number was obtained. (Δ) The global distribution in full scale. (R) The same distribution as in A with a scale of frquency limited to 50 models.
Fig. 5.
Fig. 5.
Global distribution of the conformational states of all clusters obtained by subclustering the RMSDs in individual cluster. A single bar represents the numberof clusters with the given number of subcluster (conformational states) in reference to the RMSD cutoff at which the number was obtained. (A) The full scale distribution of conformational states in the PDB, (B) The samedistribtion with frequency scale limited to 50.
Fig. 6.
Fig. 6.
An example ofthe 25 amino acds sliding window RMSD distribution in cluster 633 (diphtheria toxin). (A) Dots represent all individual 25 a.a. RMSDs wherens B shows examples of 3 models with conformational states with small (yellow), intermediate (red), and large divergence (blue).
Fig. 7.
Fig. 7.
Examples of proteins representing different ‘mobility classes’ found in the PDB. (A) cluster 48 representing a large enzyme transhydroxylase (1,236 amino acids) with a single conformational state. (B) Cluster 633 representing diphtheria toxin with a single hinge that represents a movement of the entire domain shown in yellow and red models. (C) Cluster 8,791 representing calmodulin that has the entire family of different conformational states represented. Three of these states are depicted; green an open state, blue half closed state, and purple the completely closed state. (D) Cluster 11,575 representing a fragment of apolipoprotein A. Three conformational states are represented out of many available in 2 independent crystal structures. (E) The Src kinase representing the largest conformational change detected in the PDB models represented in our database that comprises 23.7 Å RMSD between models 2src and 1y57.

References

    1. Tanford C, Reynolds J. Nature's Robots: A History of Proteins. New York: Oxford University Press; 2001.
    1. Pauling L. How my interest in proteins developed. Protein Sci. 1993;2:1060–1063. - PMC - PubMed
    1. Branden C, Tooze J. Introduction to Protein Structure. London: Taylor and Francis; 1999.
    1. Lezon TR, Banavar JR, Lesk AM, Maritan A. What determines the spectrum of protein native state structures? Proteins. 2006;63:273–277. - PubMed
    1. Caspar DL, Clarage J, Salunke DM, Clarage M. Liquid-like movements in crystalline insulin. Nature. 1988;332:659–662. - PubMed

Publication types

LinkOut - more resources