. 2009 Sep;83(17):8832-41.
doi: 10.1128/JVI.00773-09. Epub 2009 Jun 24.

Mixed infection and the genesis of influenza virus diversity

Affiliations

Mixed infection and the genesis of influenza virus diversity

Elodie Ghedin et al. J Virol. 2009 Sep.

Abstract

The emergence of viral infections with potentially devastating consequences for human health is highly dependent on their underlying evolutionary dynamics. One likely scenario for an avian influenza virus, such as A/H5N1, to evolve to one capable of human-to-human transmission is through the acquisition of genetic material from the A/H1N1 or A/H3N2 subtypes already circulating in human populations. This would require that viruses of both subtypes coinfect the same cells, generating a mixed infection, and then reassort. Determining the nature and frequency of mixed infection with influenza virus is therefore central to understanding the emergence of pandemic, antigenic, and drug-resistant strains. To better understand the potential for such events, we explored patterns of intrahost genetic diversity in recently circulating strains of human influenza virus. By analyzing multiple viral genome sequences sampled from individual influenza patients we reveal a high level of mixed infection, including diverse lineages of the same influenza virus subtype, drug-resistant and -sensitive strains, those that are likely to differ in antigenicity, and even viruses of different influenza virus types (A and B). These results reveal that individuals can harbor influenza viruses that differ in major phenotypic properties, including those that are antigenically distinct and those that differ in their sensitivity to antiviral agents.


Figures
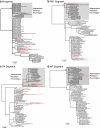
FIG. 1.
FIG. 1.
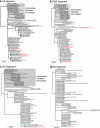
Maximum-likelihood phylogenetic trees for M (a), PB1 (b), PA (c), and NP (d) segment clones from sample NZ094 compared to a representative sample of viruses circulating in the years 2004 and 2005. Clones from sample NZ094 are shown in red and italics, while consensus segment assemblies from whole-genome sequencing of the isolate are shown in light blue. Viruses associated with adamantane resistance are shaded. All branches are drawn to a scale of nucleotide substitutions per site, and the tree is midpoint rooted for purposes of clarity only. Bootstrap support values are shown for the node distinguishing the adamantane-resistant viruses. Only small (often nonoverlapping) subcloned regions were available for the PA segment, and so no bootstrap analysis could be undertaken in this case.
FIG. 2.
FIG. 2.
Maximum-likelihood phylogenetic trees for the HA (a), PB2 (b), NA (c), and NS (d) segment clones from sample NZ094 compared to a representative sample of viruses circulating in the years 2004 and 2005. Clones from sample NZ094 are shown in red and italics, while consensus segment assemblies from whole-genome sequencing of the isolate are shown in light blue. Viruses associated with adamantane resistance are shaded in all cases. All branches are drawn to a scale of nucleotide substitutions per site, and the tree is midpoint rooted for purposes of clarity only. Bootstrap support values are shown for the node distinguishing the adamantane-resistant and -sensitive lineages. A grouping of adamantane-resistant viruses was only weakly supported in the NA gene (51% bootstrap support), and there was insufficient phylogenetic resolution in the NS gene to reveal any higher-order groupings.
FIG. 3.
FIG. 3.
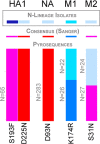
Color-coded representation of protein residues for translated pyrosequencing reads of the HA1, M, and NA segments of isolate NZ094. This representation shows the alignment of specific residues that differ from the N-lineage isolates A/Canterbury/20/2005 (GenBank accession numbers CY008340, CY008341, and CY008342), A/Canterbury/220/2005, (CY008380, CY008381, and CY008382), and A/Canterbury/237/2005 (CY008412, CY008413, and CY008414). These N-lineage isolates are highlighted by the gray box at the top of the figure. Protein residues from consensus assemblies from whole-genome sequencing of isolate NZ094 are represented above the pyrosequencing read data. The HA1 residues are numbered relative to the HA1 domain, not from the first methionine of the HA coding sequence. Color coding: light blue, N, asparagine; dark blue, F, phenylalanine; royal blue, R, arginine; turquoise, K, lysine; red, D, aspartic acid; pink, S, serine.
FIG. 4.
FIG. 4.
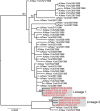
Maximum-likelihood phylogenetic tree for HA segment clones from sample WW537 in comparison with those circulating during the same time period (1997-1998 northern hemisphere season) in New York State. Clones from sample WW537 are shown in red and italics. The two antigenically distinct lineages of HA are highlighted, and bootstrap support values are shown for key nodes. All horizontal branches are drawn to a scale of nucleotide substitutions per site, and the tree is midpoint rooted for purposes of clarity only.
FIG. 5.
FIG. 5.
Alignment of nonconserved HA1 residues of the HA across all eight clones from sample WW537. Numbering of the residues is given both from the first methionine of the coding sequence (CDS) and from the first residue of the HA1 domain (HA1 numbering). Gray letters at the top of each column correspond to residues of epitopic sites where antibodies have been shown to bind. L, leucine; S, serine; K, lysine; E, glutamic acid; Q, glutamine; T, threonine; N, asparagine; G, glycine; R, arginine; V, valine; A, alanine; I, isoleucine; D, aspartic acid.

References

    1. Centers for Disease Control and Prevention. 1998. Update: influenza activity—United States and worldwide, 1997-98 season, and composition of the 1998-99 influenza vaccine. MMWR Morb. Mortal. Wkly. Rep. 47280-284. - PubMed
    1. Delcher, A. L., S. L. Salzberg, and A. M. Phillippy. 2003. Using MUMmer to identify similar regions in large sequence sets. Curr. Protoc. Bioinformatics 1010.3. - PubMed
    1. Dugan, V. G., R. Chen, D. J. Spiro, N. Sengamalay, J. Zaborsky, E. Ghedin, J. Nolting, D. E. Swayne, J. A. Runstadler, G. M. Happ, D. A. Senne, R. Wang, R. D. Slemons, E. C. Holmes, and J. K. Taubenberger. 2008. The evolutionary genetics and emergence of avian influenza viruses in wild birds. PLoS Pathog. 4e1000076. - PMC - PubMed
    1. Eriksson, N., L. Pachter, Y. Mitsuya, S. Y. Rhee, C. Wang, B. Gharizadeh, M. Ronaghi, R. W. Shafer, and N. Beerenwinkel. 2008. Viral population estimation using pyrosequencing. PLoS Comput. Biol. 4e1000074. - PMC - PubMed
    1. Finkelstein, D. B., S. Mukatira, P. K. Mehta, J. C. Obenauer, X. Su, R. G. Webster, and C. W. Naeve. 2007. Persistent host markers in pandemic and H5N1 influenza viruses. J. Virol. 8110292-10299. - PMC - PubMed

Publication types