. 2009 Jun 24;29(25):8166-76.
doi: 10.1523/JNEUROSCI.0243-09.2009.

Functional significance of nonspatial information in monkey lateral intraparietal area

Affiliations

Functional significance of nonspatial information in monkey lateral intraparietal area

Puiu F Balan et al. J Neurosci. .

Abstract

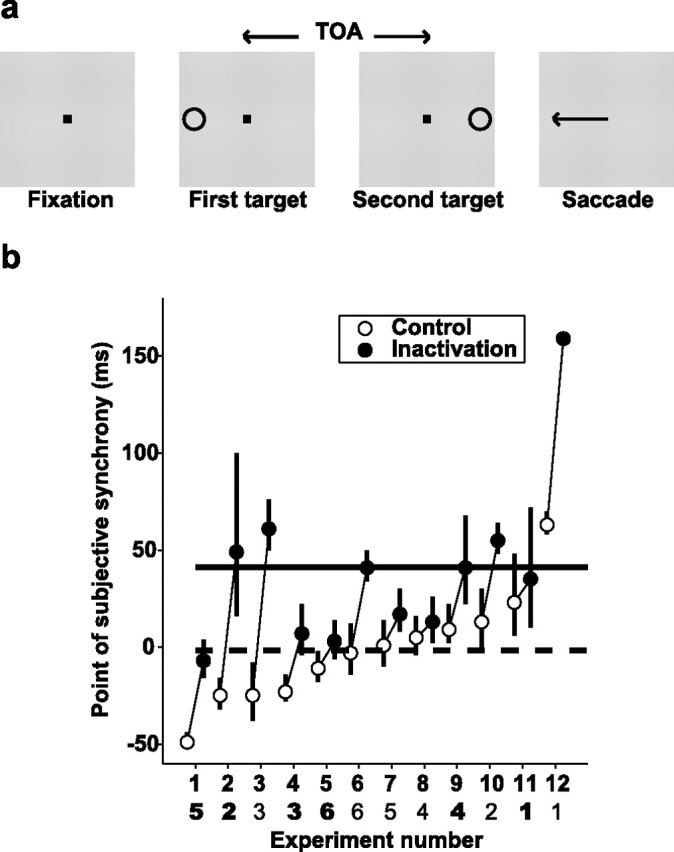
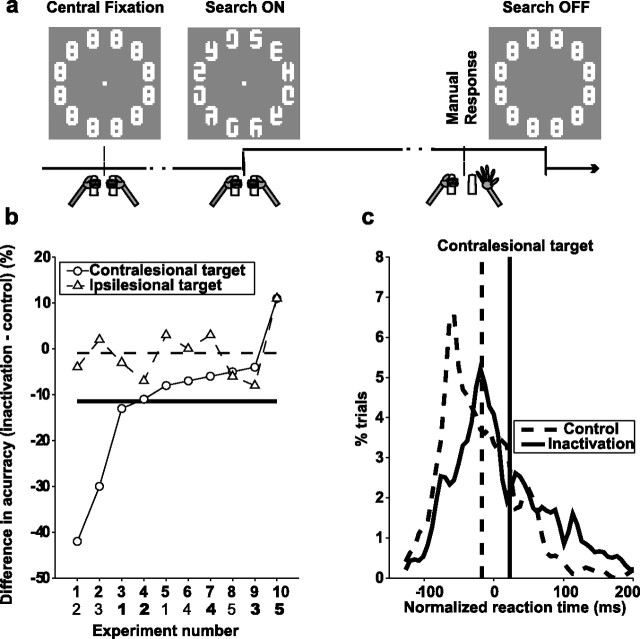
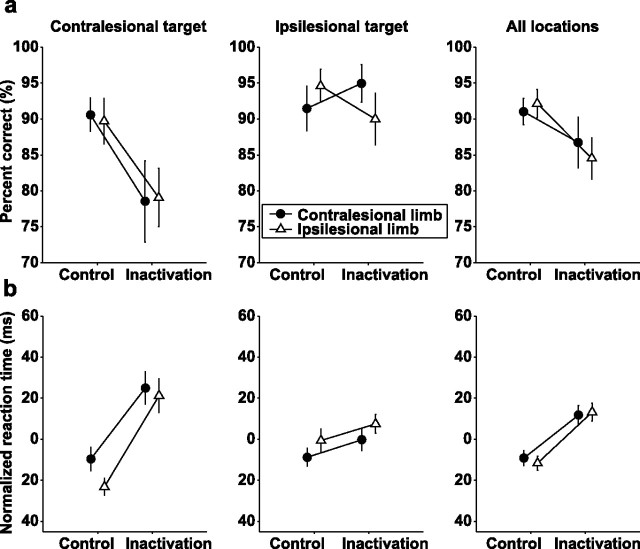
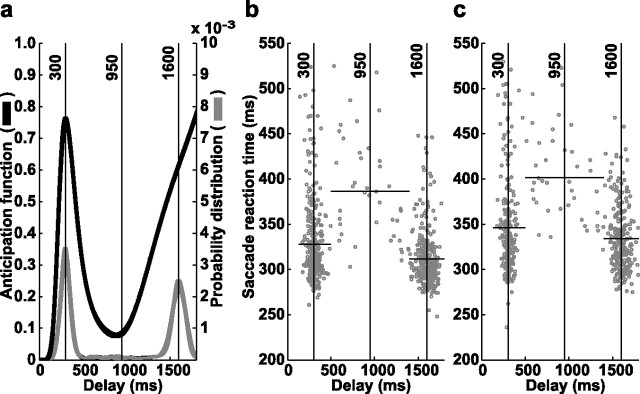
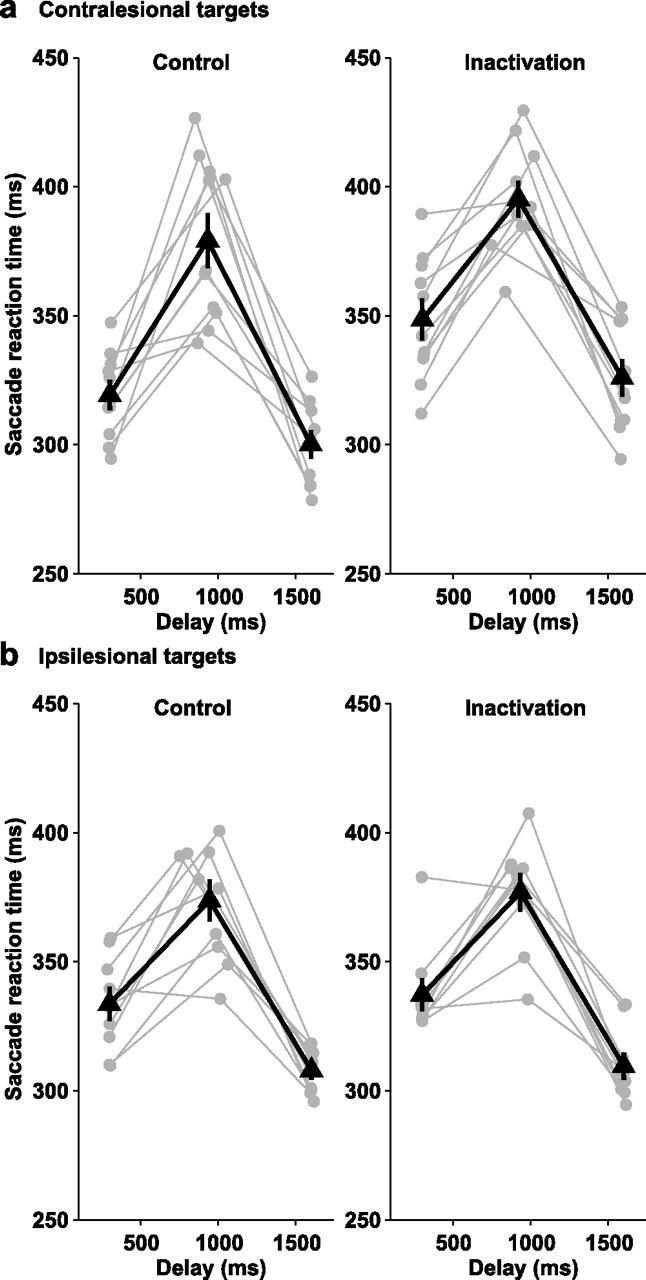
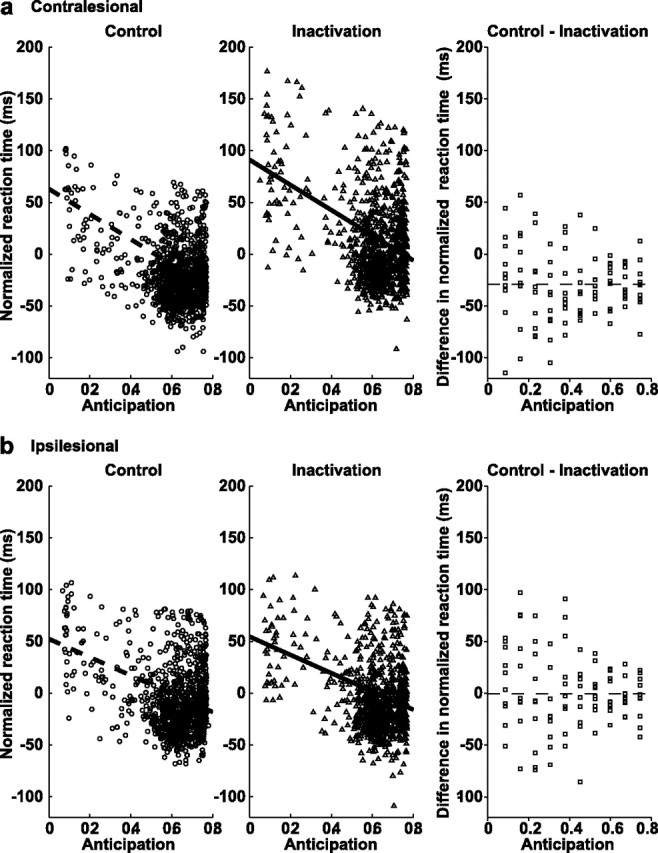
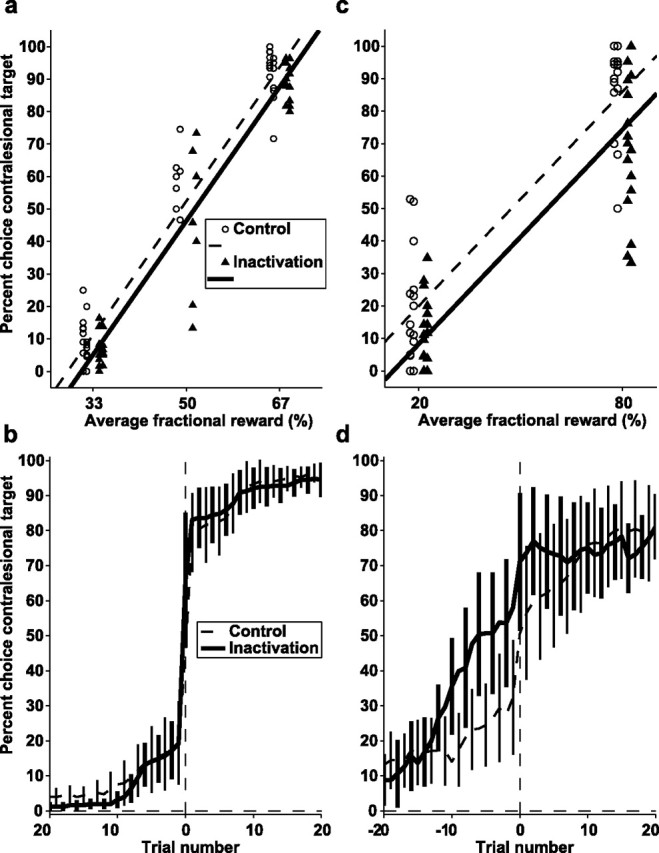
Although the parietal cortex is traditionally associated with spatial perception and motor planning, recent evidence shows that neurons in the lateral intraparietal area (LIP) carry both spatial and nonspatial signals. The functional significance of the nonspatial information in the parietal cortex is not understood. To address this question, we tested the effect of unilateral reversible inactivation of LIP on three behavioral tasks known to evoke nonspatial responses. Each task included a spatial component (target selection in the hemifield contralateral or ipsilateral to the inactivation) and a nonspatial component, namely limb motor planning, the estimation of elapsed time, and reward-based decisions. Although inactivation reliably impaired performance on all tasks, the deficits were spatially specific (restricted to contralateral target locations), and there were no effects on nonspatial aspects on performance. This suggests that modulatory nonspatial signals in LIP represent feedback about computations performed elsewhere rather than a primary role of LIP in these computations.


Figures

Figure 1.
Figure 1.
Double-target saccade task. a, Sequence of events during the task. A trial began when the monkey achieved fixation (left). A visual target was flashed for 100 ms and was followed, at a variable target onset asynchrony (TOA), by a second target flashed for 100 ms at the diametrically opposite location. One hundred milliseconds after extinction of the second target, the fixation point was turned off and the monkeys made a saccade to the first appearing stimulus (right). b, The PSS for each of the 12 experiments. Each connected pair of points shows the PSS (and the 95% CI calculated from the SD of the logistic fit) for a pair of control (open symbols) and inactivation (filled symbols) session. Experiments are sorted in order of increasing PSS in the control session and not in the order in which they occurred. However, the bottom row of abscissa labels shows the chronological order of experiments sorted by monkey (bold symbols refer to monkey D). Average PSS for all control and inactivation sessions are indicated with the dashed and solid horizontal lines.
Figure 2.
Figure 2.
Covert visual search task. a, Sequence of events during a representative trial. A stable placeholder array remained visible throughout the intertrial interval. To initiate a trial, monkeys were required to achieve central fixation and grasp two response bars (left). The search display was then presented by removing a fraction of two lines from each display element (middle). This revealed a display with a target (a right- or left-facing letter E) and 11 unique distractors. Monkeys were rewarded for indicating the orientation of the target by releasing grasp of a bar held in the right or left paw, without shifting gaze from the center (Manual Response). The trial ended with removal of the fixation point, a reward, if appropriate, and restoration of the placeholder display 300 ms after the bar release. b, Inactivation effects on response accuracy in each experiment. Each point shows the difference in percentage correct between an inactivation and control session, when the target was contralesional (circles) or ipsilesional (triangles) to the inactivated hemisphere. Experiments are arranged in order of increasing effect for the contralesional target, and chronological order is given in the bottom row of abscissa labels (bold symbols refer to monkey D). The solid and dashed horizontal lines show the average difference for contralesional and ipsilesional targets, respectively. c, Distribution of normalized reaction times, pooled across all control (dashed) and inactivation (solid) sessions for contralesional targets. Reaction times were normalized by subtracting the average reaction time in each experiment (each pair of control-inactivation session). Vertical lines show averages for control and inactivation data.
Figure 3.
Figure 3.
Covert visual search task: effect of target location and limb. a, Average accuracy in trials sorted according to target location, active limb, and inactivation condition. Each point represents the mean and SE across sessions. b, Same as in a but for reaction times.
Figure 4.
Figure 4.
Temporal anticipation task. a, The gray curve shows the probability distribution of the delay values used (pooled across all experiments in monkey D; bin size, 1 ms). The solid curve shows the subjective anticipation (hazard) function calculated from the delay distribution, as described in Materials and Methods. Shading shows ±1 SD. b, Saccade reaction times for contralesional (rightward) saccades in monkey D, collapsed across all control sessions. Each point represents one trial. The vertical lines show the average delay in each delay group. The short horizontal lines show the average reaction time for each delay category; their horizontal extent indicates the range of delays included in each category (short delays, 170–470 ms; intermediate delays, 500–1400 ms; and long delays, 1430–1800 ms). c, Results from inactivation sessions with contralesional targets in monkey D, in the same format as in b.
Figure 5.
Figure 5.
Temporal anticipation task: dependence of SRT on delay an SRT as a function of delay on contralesional target trials, in control (left) and inactivation (right) sessions. Each triplet of connected gray symbols shows the average reaction time in the three delay bins, for one session. The filled triangles show the mean and SEs across all sessions. b, Same as in a, for ipsilesional saccades.
Figure 6.
Figure 6.
Temporal anticipation task: dependence of SRT on anticipation. a, Normalized SRT as a function of anticipation for contralesional targets in control (left) and inactivation (right) sessions. Each point shows an individual trial. The lines show the best-fit solution from the weighted ANCOVA. For clarity of presentation, trials with regression weight below 0.2 are excluded. The right shows the difference between control and inactivation SRT in 10 equal anticipation bins; each point shows the difference in one pair of control and inactivation session. The dashed line shows the best-fit weighted linear regression. b, Same as a, for ipsilesional targets.
Figure 7.
Figure 7.
Free-choice saccade tasks. a, Percentage contralesional choices as a function of fractional reward in the space-reward task. Each point represents a single session, and lines are simultaneous fits through the data using ANCOVA. For clarity of presentation, points representing control and inactivation sessions were slightly separated along the horizontal axis. b, Temporal profile of choice behavior on the space-reward task, in all inactivation (solid) and control (dashed) sessions in which the contralesional target started by having the lower reward value. Trials were aligned on the reversal point (trial 0), and the average fraction of choice of the contralesional target was calculated in a sliding window (width 10 trials, stepped 1 trials, bounded at the reversal trial). Error bars represent confidence intervals of the mean across sessions. Bins with significant differences between control and inactivation sessions (one-way ANOVA, p < 0.05) are indicated with an asterisk. c, d, Data from the color-reward task in the same format as in a and b.

References

    1. Balan PF, Gottlieb J. Integration of exogenous input into a dynamic salience map revealed by perturbing attention. J Neurosci. 2006;26:9239–9249. - PMC - PubMed
    1. Balan PF, Oristaglio J, Schneider DM, Gottlieb J. Neuronal correlates of the set-size effect in monkey lateral intraparietal area. PLoS Biol. 2008;6:e158. - PMC - PubMed
    1. Barash S, Bracewell RM, Fogassi L, Gnadt JW, Andersen RA. Saccade-related activity in the lateral intraparietal area. I. Temporal properties. J Neurophysiol. 1991;66:1095–1108. - PubMed
    1. Battelli L, Walsh V, Pascual-Leone A, Cavanagh P. The “when” parietal pathway explored by lesion studies. Curr Opin Neurobiol. 2008;18:120–126. - PMC - PubMed
    1. Bisley JW, Goldberg ME. Neuronal activity in the lateral intraparietal area and spatial attention. Science. 2003;299:81–86. - PubMed

Publication types

MeSH terms