. 2009 Jun 24;29(25):8177-86.
doi: 10.1523/JNEUROSCI.1375-09.2009.

Opioids depress cortical centers responsible for the volitional control of respiration

Affiliations

Opioids depress cortical centers responsible for the volitional control of respiration

Kyle T S Pattinson et al. J Neurosci. .

Abstract

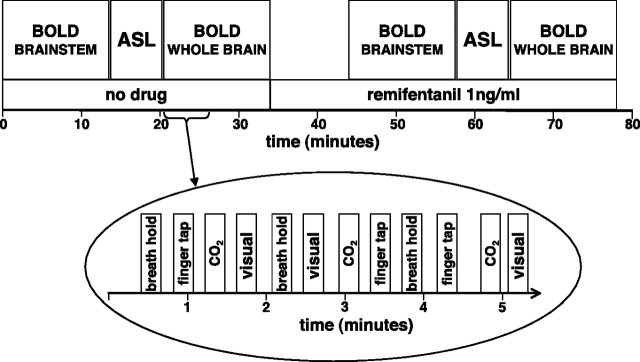
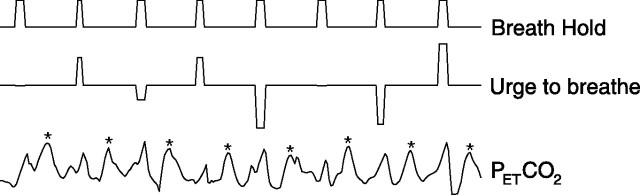
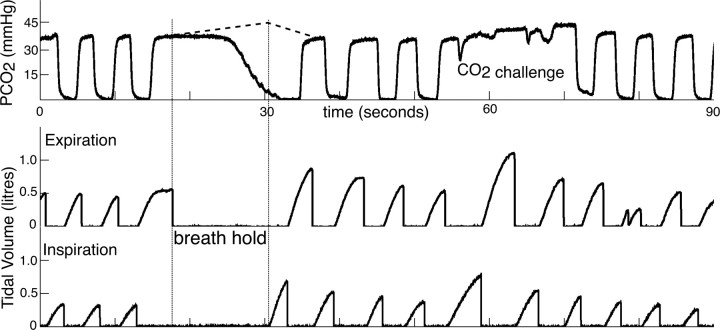
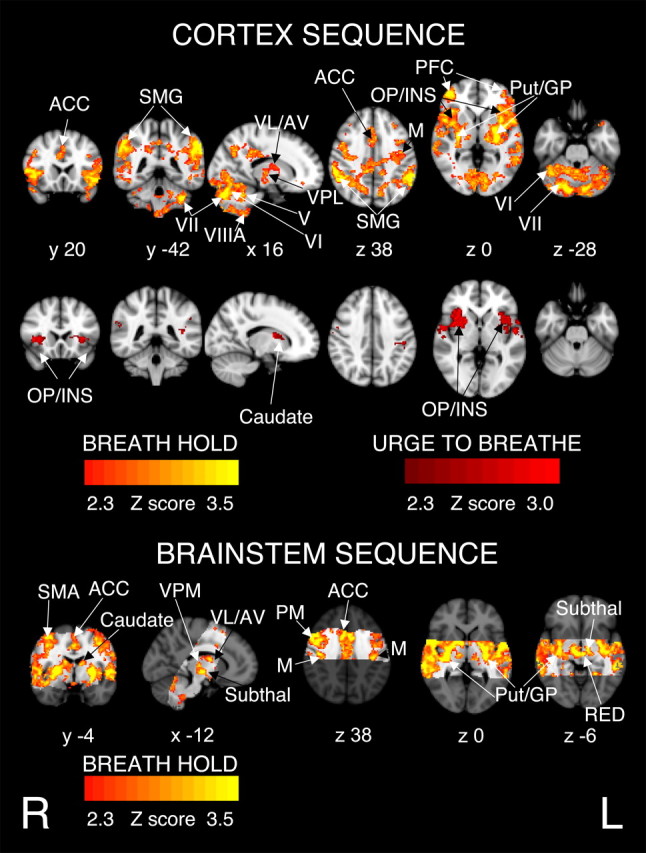
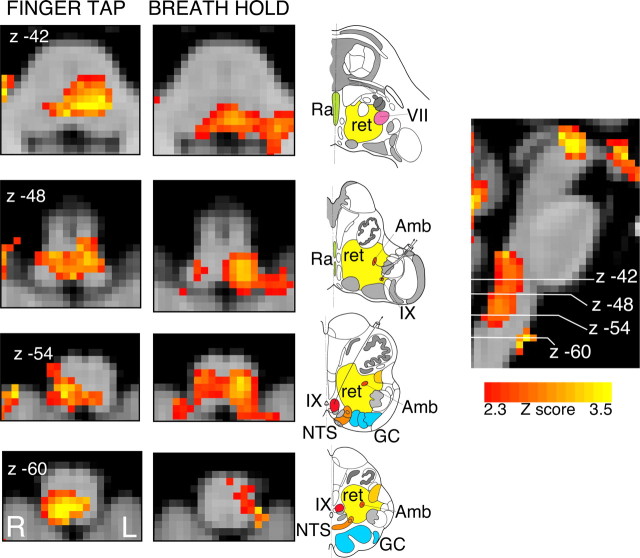
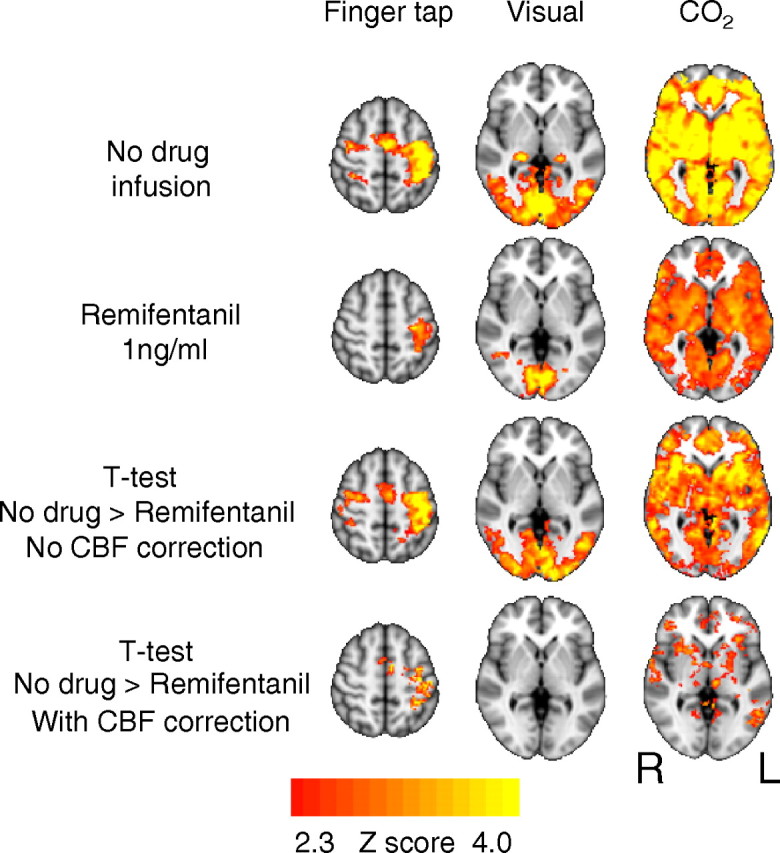
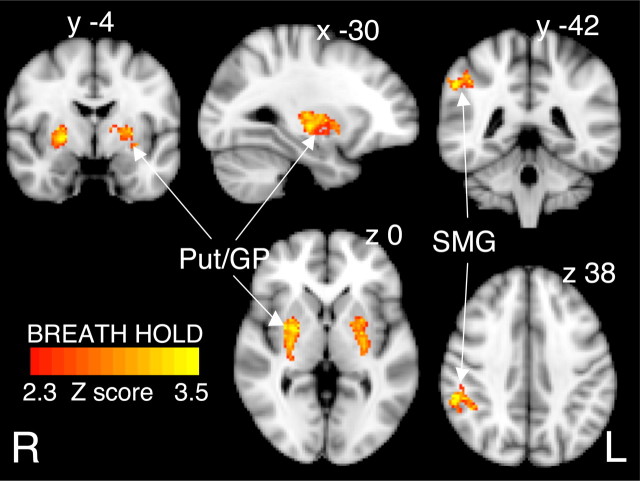
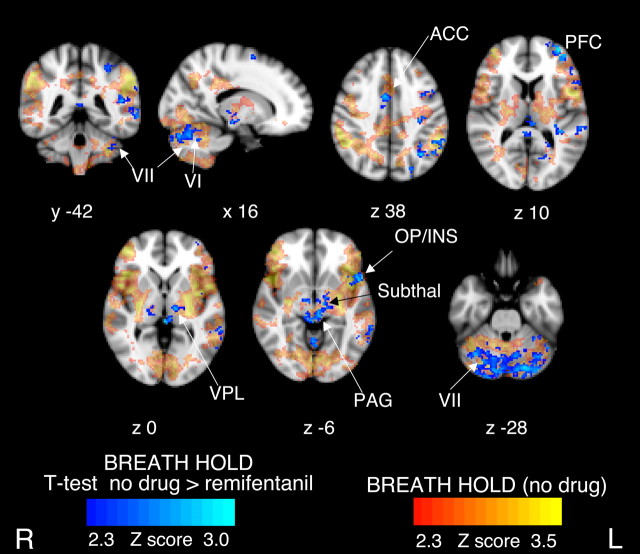
Respiratory depression limits provision of safe opioid analgesia and is the main cause of death in drug addicts. Although opioids are known to inhibit brainstem respiratory activity, their effects on cortical areas that mediate respiration are less well understood. Here, functional magnetic resonance imaging was used to examine how brainstem and cortical activity related to a short breath hold is modulated by the opioid remifentanil. We hypothesized that remifentanil would differentially depress brain areas that mediate sensory-affective components of respiration over those that mediate volitional motor control. Quantitative measures of cerebral blood flow were used to control for hypercapnia-induced changes in blood oxygen level-dependent (BOLD) signal. Awareness of respiration, reflected by an urge-to-breathe score, was profoundly reduced with remifentanil. Urge to breathe was associated with activity in the bilateral insula, frontal operculum, and secondary somatosensory cortex. Localized remifentanil-induced decreases in breath hold-related activity were observed in the left anterior insula and operculum. We also observed remifentanil-induced decreases in the BOLD response to breath holding in the left dorsolateral prefrontal cortex, anterior cingulate, the cerebellum, and periaqueductal gray, brain areas that mediate task performance. Activity in areas mediating motor control (putamen, motor cortex) and sensory-motor integration (supramarginal gyrus) were unaffected by remifentanil. Breath hold-related activity was observed in the medulla. These findings highlight the importance of higher cortical centers in providing contextual awareness of respiration that leads to appropriate modulation of respiratory control. Opioids have profound effects on the cortical centers that control breathing, which potentiates their actions in the brainstem.


Figures

Figure 1.
Figure 1.
Overview of the experiment. The order of the three scans was randomized between subjects. The bottom part of the picture shows the stimuli delivery during the whole-brain BOLD sequence. The stimuli presentations were similar in nature during the brainstem sequence, but without visual stimulation.
Figure 2.
Figure 2.
Illustration of the statistical model used to differentiate the breath hold, urge to breathe, and PETCO2 regressors for the first-level fMRI analysis (values are demeaned). For clarity, the visual stimulation and finger-tapping tasks are not displayed. The asterisk (*) indicates CO2 peaks caused by extra CO2 administered through the breathing system.
Figure 3.
Figure 3.
Portion of respiratory trace from one subject demonstrating the tidal CO2 trace (top trace), the expiratory tidal volume trace (middle trace), and inspiratory tidal volume (bottom trace). The duration of the breath hold was calculated from the time between end of expiratory airflow and beginning of inspiratory airflow (the time between the two vertical bars on the chart). The rise in PETCO2 during the breath hold was modeled from the average of three inspiratory breath holds performed before the study, and is shown as a dotted line.
Figure 4.
Figure 4.
BOLD response to breath hold, in 11 subjects having accounted for CO2-induced vasodilatation. There were no activations related to the trial-to-trial varying urge to breathe in the brainstem sequence. The images consist of a color-rendered statistical map superimposed on a standard (MNI) brain. The bright gray region on the brainstem sequence delineates the coverage for the brainstem scanning. Significant regions are displayed with a threshold of Z > 2.3, with a cluster probability threshold of p < 0.05 (corrected for multiple comparisons). Abbreviations: ACC, Anterior cingulate cortex; SMG, supramarginal gyrus; thalamic nuclei: VL, ventrolateral nucleus; VPL, ventral posterolateral nucleus; AV, anterior ventral nucleus; VPM, ventral posteromedial nucleus; PFC, prefrontal cortex; OP/INS, operculum and insula; M, motor cortex; PM, premotor cortex; SMA, supplementary motor area; Put, putamen; GP, globus pallidum; V, VI, VII, VIIIA, cerebellar lobes; Subthal, subthalamic nucleus; RED, red nuclei. R (right) and L (left) indicate image orientation for images in x and z planes.
Figure 5.
Figure 5.
BOLD response in the brainstem to finger tapping and to breath hold, in 11 subjects (no-drug infusion) having accounted for CO2-induced vasodilatation. The images consist of a color-rendered statistical map superimposed on a standard (MNI) brain. Significant regions are displayed with a threshold of Z > 2.3, with a cluster probability threshold of p < 0.05 (corrected for multiple comparisons). The sagittal image on the right displays the position of slices, but for clarity only displays the activation map for the breath hold contrast. Abbreviations: R, Raphe nuclei (serotoninergic); ret, nuclei reticularis including adrenergic and noradrenergic centers; VII, facial nucleus; Amb, nucleus ambiguus; IX, glossopharyngeal nucleus; NTS, nucleus tractus solitarius; GC, gracile (medial) and cuneate (lateral) nuclei (in blue). Line drawing is adapted from Duvernoy (1995) showing approximate position of nuclei. R (right) and L (left) indicate image orientation.
Figure 6.
Figure 6.
Comparison of BOLD response to finger tapping, visual stimulation, and CO2 challenges before and during infusion of remifentanil. The images consist of a color-rendered statistical map of changes in activation (Z scores) superimposed on a standard (MNI) brain. Significant regions are displayed with a threshold of Z > 2.3, with a cluster probability threshold of p < 0.05 (corrected for multiple comparisons). The apparent strong difference in activations between no-drug and remifentanil conditions is mostly explained by the change in baseline cerebral blood flow. R (right) and L (left) indicate image orientation for images in x and z planes.
Figure 7.
Figure 7.
BOLD response to breath holding during infusion of remifentanil (1 ng/ml), without CBF correction. The only activations to remain are seen in the putamen and caudate, bilaterally, and the left supramarginal gyrus. The images consist of a color-rendered statistical map of changes in activation (Z scores) superimposed on a standard (MNI) brain. Significant regions are displayed with a threshold of Z > 2.3, with a cluster probability threshold of p < 0.05 (corrected for multiple comparisons). R (right) and L (left) indicate image orientation for images in x and z planes.
Figure 8.
Figure 8.
t test demonstrating areas with significantly stronger BOLD response to trial-to-trial invariant component of breath hold during the no-drug condition, compared with remifentanil infusion having accounted for differences in baseline CBF. There were no differences in the trial-to-trial varying urge-to-breathe contrast, and therefore it is not displayed. The images consist of a color-rendered statistical map of changes inactivation (Z scores) superimposed on a standard (MNI) brain. The BOLD responses to the baseline (no-drug) state are displayed in red–yellow scale and are fully detailed in Figure 4. Significant regions are displayed with a threshold of Z > 2.3, with a cluster probability threshold of p < 0.05 (corrected for multiple comparisons). Abbreviations: Cerebellar lobes VI and VII; ACC, anterior cingulate cortex; PFC, prefrontal cortex; VPL, ventroposterolateral nucleus of thalamus; OP/INS, operculum and insula; Subthal, subthalamic nucleus. R (right) and L (left) indicate image orientation.

Similar articles

Cited by

References

    1. Alexander GE, DeLong MR, Strick PL. Parallel organization of functionally segregated circuits linking basal ganglia and cortex. Annu Rev Neurosci. 1986;9:357–381. - PubMed
    1. Andersson J, Jenkinson M, Smith SM. Oxford: Oxford Centre for Functional Magnetic Resonance Imaging of the Brain; 2007. Non-linear registration, aka spatial normalisation. FMRIB technical report TR07JA2.
    1. Aron AR, Poldrack RA. Cortical and subcortical contributions to Stop signal response inhibition: role of the subthalamic nucleus. J Neurosci. 2006;26:2424–2433. - PMC - PubMed
    1. ATS. Dyspnea. Mechanisms, assessment, and management: a consensus statement. American Thoracic Society. Am J Respir Crit Care Med. 1999;159:321–340. - PubMed
    1. Bailey PL, Lu JK, Pace NL, Orr JA, White JL, Hamber EA, Slawson MH, Crouch DJ, Rollins DE. Effects of intrathecal morphine on the ventilatory response to hypoxia. N Engl J Med. 2000;343:1228–1234. - PubMed

Publication types

MeSH terms

LinkOut - more resources