. 2009 Jun 24;29(25):8288-97.
doi: 10.1523/JNEUROSCI.0097-09.2009.

Histone deacetylases 1 and 2 form a developmental switch that controls excitatory synapse maturation and function

Affiliations

Histone deacetylases 1 and 2 form a developmental switch that controls excitatory synapse maturation and function

Mohd W Akhtar et al. J Neurosci. .

Abstract

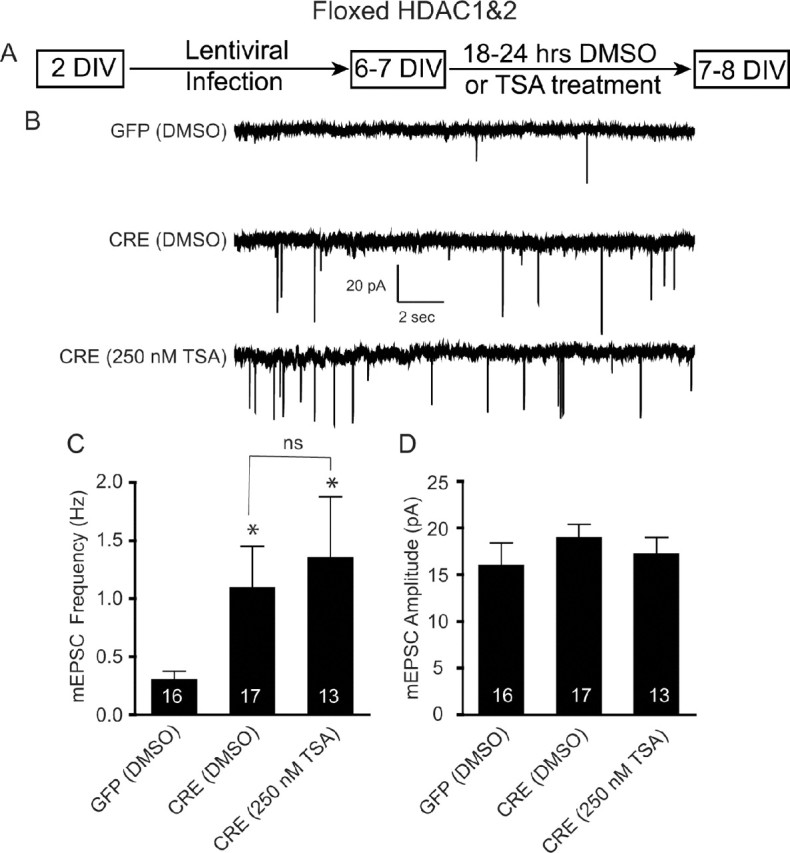
The structural assembly of synapses can be accomplished in a rapid time frame, although most nascent synapses formed during early development are not fully functional and respond poorly to presynaptic action potentials. The mechanisms that are responsible for this delay in synapse maturation are unknown. Histone deacetylases (HDACs) regulate the activity state of chromatin and repress gene expression through the removal of acetyl groups from histones. Class I HDACs, which include HDAC1 and HDAC2, are expressed in the CNS, although their specific role in neuronal function has not been studied. To delineate the contribution of HDAC1 and HDAC2 in the brain, we have used pharmacological inhibitors of HDACs and mice with conditional alleles to HDAC1 and HDAC2. We found that a decrease in the activities of both HDAC1 and HDAC2 during early synaptic development causes a robust facilitation of excitatory synapse maturation and a modest increase in synapse numbers. In contrast, in mature neurons a decrease in HDAC2 levels alone was sufficient to attenuate basal excitatory neurotransmission without a significant change in the numbers of detectable nerve terminals. Therefore, we propose that HDAC1 and HDAC2 form a developmental switch that controls synapse maturation and function acting in a manner dependent on the maturational states of neuronal networks.


Figures

Figure 1.
Figure 1.
Increased spontaneous excitatory neurotransmission and synapse formation in immature hippocampal neurons (5 DIV) following 18–24 h of treatment with the histone deacetylase inhibitor TSA. A, Schematic timeline of the experiment. B–D, Spontaneous excitatory synaptic currents upon 250 nm TSA treatments for 18–24 h. B, Representative recording of miniature excitatory events in DMSO and TSA-treated neurons recorded in 1 μm tetrodotoxin and 50 μm picrotoxin. C, Bar graph depicts the significant increase in mEPSC frequency following TSA treatment. The numbers in the bars denote the number of neurons recorded for each condition. D, Bar graph of mEPSC amplitude reveals no change following TSA treatment. E–G, Representative images of immunostaining of young hippocampal culture (5 DIV). Immunostaining was performed using synapsin (red) and PSD-95 (green) antibodies. White arrows indicate the colocalized puncta. H–J, Bar graphs depict the number of synapsin puncta (H), PSD-95 puncta (I), and colocalized synapsin and PSD-95 puncta (J) calculated from confocal images using ImageJ software. The immunocytochemistry was performed in triplicate in cultures from three independent experiments. K, Representative recordings of sucrose response. L, Bar graph depicting the charge/30 s calculated using mEPSC recordings upon application of 500 mm sucrose revealed a significant increase in sucrose response following TSA treatment (*p < 0.05 in this and all subsequent figures). M, Representative recordings depicting EPSCs evoked in response to action potential stimulation in cultures treated with either DMSO or 250 nm TSA. After TSA treatment an increased fraction of neurons exhibited response to stimulation compared with DMSO treatment. N, Cumulative histogram shows that a higher percentage of cells respond to evoked stimulation upon 250 nm TSA treatment compared with control DMSO treatment.
Figure 2.
Figure 2.
Deletion of HDAC1&2 increases spontaneous excitatory neurotransmission in immature hippocampal neurons. A, A schematic of the experimental timeline showing that young neurons at 2 DIV were infected with lentivirus (GFP or CRE) and recordings were performed on 7–8 DIV. B, E, H, Representative recordings of miniature excitatory events recorded in 1 μm tetrodotoxin and 50 μm picrotoxin in GFP- and CRE-infected HDAC1, HDAC2, or HDAC1&2 neurons, respectively. C, F, I, Bar graph depicting the mEPSC frequency following the loss of HDAC1, HDAC2, or HDAC1&2. The loss of HDAC1 or HDAC2 had no significant effect on mEPSC frequency, while the loss of HDAC1&2 produced a significant increase in mEPSC frequency. D, G, J, Bar graphs of mEPSC amplitudes showing no change following the loss of HDAC1, HDAC2, or HDAC1&2 in young neurons.
Figure 3.
Figure 3.
Occlusion of TSA-mediated increase in mEPSC in immature neurons lacking HDAC1&2. A, Schematic timeline of the experiment. Floxed HDAC1&2 neurons were plated, infected with lentivirus expressing either GFP or CRE at 2 DIV, treated with DMSO or TSA (250 nm) at 6–7 DIV, and recorded 18–24 h later. B, Representative recordings of miniature excitatory events in GFP- and CRE-infected neurons treated with either DMSO or TSA. Recordings were made in Tyrode's solution containing 1 μm tetrodotoxin and 50 μm picrotoxin. C, Bar graph showing that the loss of HDAC1&2 results in a significant increase in mEPSC frequency and that TSA treatment did not result in a further increase in mEPSC frequency. D, Bar graph of mEPSC amplitudes revealing no change following TSA treatment on HDAC1&2 knockdown neurons.
Figure 4.
Figure 4.
Knockdown of HDAC1&2 accelerates synaptic vesicle mobilization in immature hippocampal neurons. A, Schematic timeline of the experiment. B, C, Monitoring the activity-dependent uptake and release of the fast-departitioning styryl dye FM2-10 (400 μm). To probe the release kinetics, synaptic boutons were loaded with FM2-10 in the presence of a 47 mm K+/2 mm Ca2+ solution for 90 s to ensure maximal uptake of the dye into individual synapses. The degree of loading was determined after multiple applications of the 90 mm K+/2 mm Ca2+ solution to establish baseline levels of fluorescence. B, At 7 DIV, when challenged with 90 mm K+ solution, GFP-infected cultures maximally labeled with FM2-10 showed slow dye release typical of the immature synapses. C, In contrast, synapses formed in the floxed HDAC1&2 cultures after CRE infection showed robust FM dye loss similar to synaptic boutons seen at later stages of synaptic maturation. The superimposed gray lines correspond to the first-order exponential decay fitted onto raw traces to extract destaining kinetics. D, Normalized cumulative histograms of time constant values for the CRE-infected neurons and the GFP-infected neurons. The difference between the two distributions is statistically significant [Kolmogorov–Smirnov test, p < 0.001, n = 1695 (GFP) and 1015 (CRE) boutons]. E, Total pool sizes measured as the maximum value of fluorescence after loading with FM 2–10, for CRE-infected neurons (n = 9) and GFP-infected neurons (n = 6).
Figure 5.
Figure 5.
HDAC1&2 deletion using low-titer lentiviral infection does not affect spontaneous excitatory neurotransmission. A, Schematic timeline of the experiment showing that 2 DIV after floxed HDAC1&2 neurons were plated and infected with low titer lentivirus expressing either GFP or CRE. B, Representative recordings of miniature excitatory events in GFP- and CRE-infected neurons (low-titer) in 1 μm tetrodotoxin and 50 μm picrotoxin. C, Bar graph showing that mEPSC frequency was not significantly different when recorded from an infected neuron in which the majority of presynaptic cells were uninfected. D, Bar graph of mEPSC amplitudes, also showing no change following the low-titer lentiviral infection of floxed HDAC1&2 neurons.
Figure 6.
Figure 6.
In mature neurons, HDAC2 but not HDAC1 deletion affects spontaneous excitatory neurotransmission. A, Schematic of the experimental timeline showing that floxed HDAC1 or HDAC2 neurons were infected with lentivirus expressing either GFP or CRE on 7 DIV then at 15 DIV cultures were treated with either DMSO vehicle or TSA (1 μm) and then recorded at 16 DIV. B, Representative recordings of miniature excitatory events in GFP- and CRE-infected neurons treated with either DMSO or TSA. Recordings were made in Tyrode's solution containing 1 μm tetrodotoxin and 50 μm picrotoxin. C, Bar graph depicting the significant decrease in mEPSC frequency observed by TSA treatment. In HDAC1 knockdown mature neurons, there was no change in mEPSC treatment, however treatment with TSA did significantly decrease mEPSC frequency. In mature neurons, knockdown of HDAC2 resulted in a significant decrease in mEPSC frequency revealing its importance in mediating synaptic transmission in mature neurons. TSA treatment of neurons with HDAC2 knockdown did not produce a further significant decrease in mEPSC frequency. D, A bar graph of mEPSC amplitude did not reveal a significant change in amplitude in any of the conditions examined in mature neurons. E, F, H, I, Representative images of immunostaining of mature hippocampal culture (15 DIV). Immunostaining was performed using PSD-95 and synapsin antibodies. G, J, Bar graphs depicting the number of PSD-95 and synapsin colocalized puncta/20 μm length of the dendrite.
Figure 7.
Figure 7.
Overexpression of HDAC2 increases spontaneous excitatory neurotransmission in mature hippocampal neurons A, Schematic of the experimental timeline showing that hippocampal neurons were infected with lentivirus expressing either GFP or GFP-HDAC2 on 7 DIV and then recorded at 16–18 DIV. B, Representative recordings of miniature excitatory events in GFP and GFP-HDAC2-infected neurons. Recordings were made in Tyrode's solution containing 1 μm tetrodotoxin and 50 μm picrotoxin. C, Bar graph depicting the significant increase in mEPSC frequency observed by HDAC2 overexpression. D, A bar graph of mEPSC amplitude did not reveal a significant change in amplitudes between GFP- and GFP-HDAC2-infected mature neurons.

References

    1. Abel T, Zukin RS. Epigenetic targets of HDAC inhibition in neurodegenerative and psychiatric disorders. Curr Opin Pharmacol. 2008;8:57–64. - PMC - PubMed
    1. Aghajanian GK, Bloom FE. The formation of synaptic junctions in developing rat brain: a quantitative electron microscopic study. Brain Res. 1967;6:716–727. - PubMed
    1. Ahmari SE, Buchanan J, Smith SJ. Assembly of presynaptic active zones from cytoplasmic transport packets. Nat Neurosci. 2000;3:445–451. - PubMed
    1. Akins MR, Biederer T. Cell-cell interactions in synaptogenesis. Curr Opin Neurobiol. 2006;16:83–89. - PubMed
    1. Asaka Y, Jugloff DG, Zhang L, Eubanks JH, Fitzsimonds RM. Hippocampal synaptic plasticity is impaired in the Mecp2-null mouse model of Rett syndrome. Neurobiol Dis. 2006;21:217–227. - PubMed

Publication types

MeSH terms

LinkOut - more resources