. 2009 Aug;102(2):1254-64.
doi: 10.1152/jn.00346.2009. Epub 2009 Jun 24.

The influence of neuroactive steroid lipophilicity on GABAA receptor modulation: evidence for a low-affinity interaction

Affiliations

The influence of neuroactive steroid lipophilicity on GABAA receptor modulation: evidence for a low-affinity interaction

Mariangela Chisari et al. J Neurophysiol. 2009 Aug.

Abstract

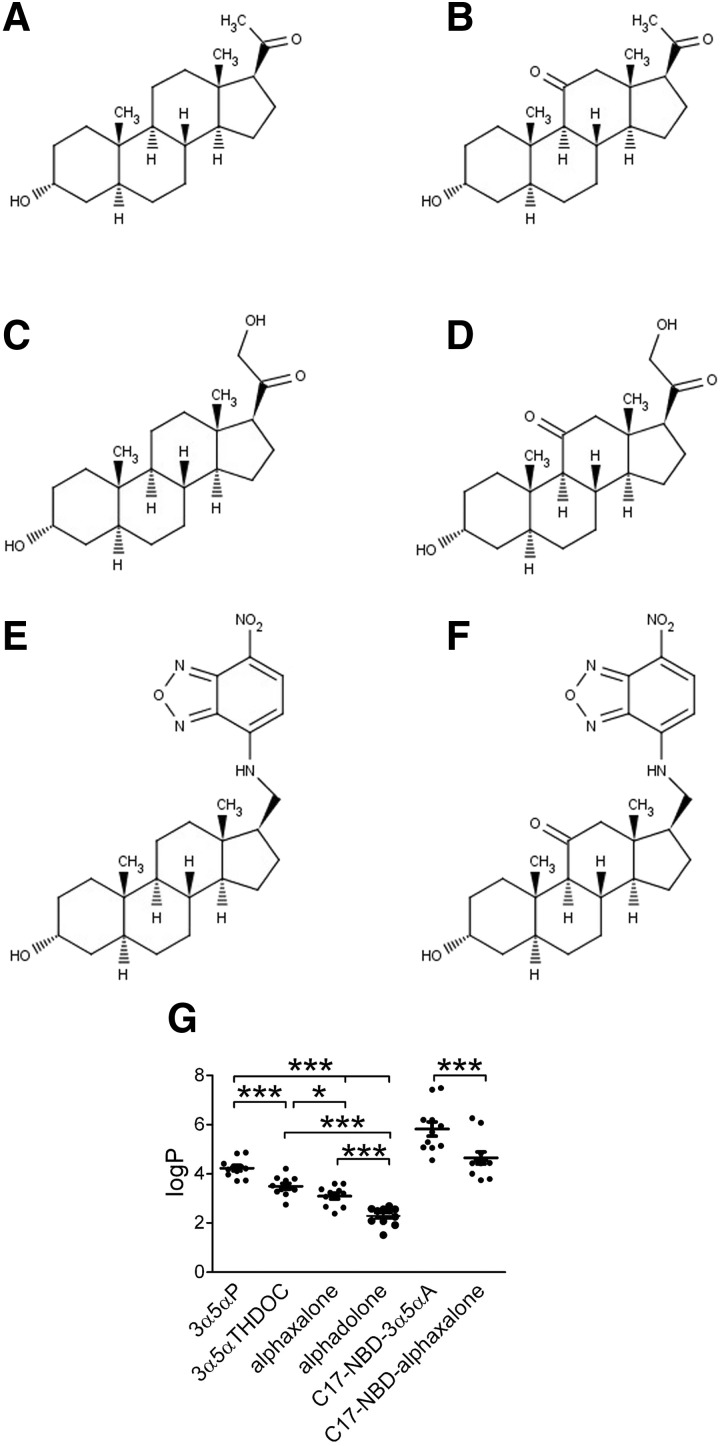
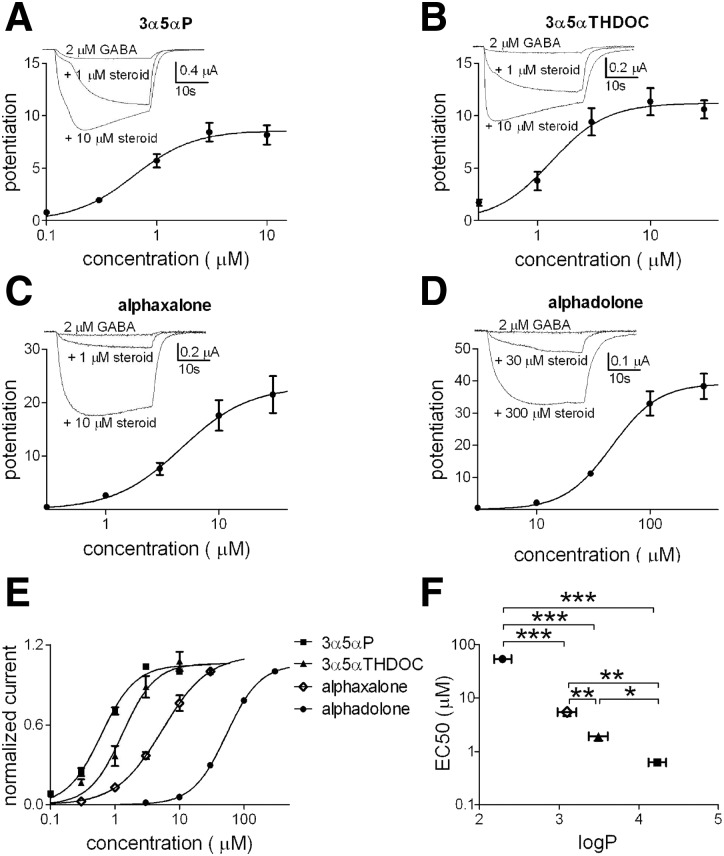
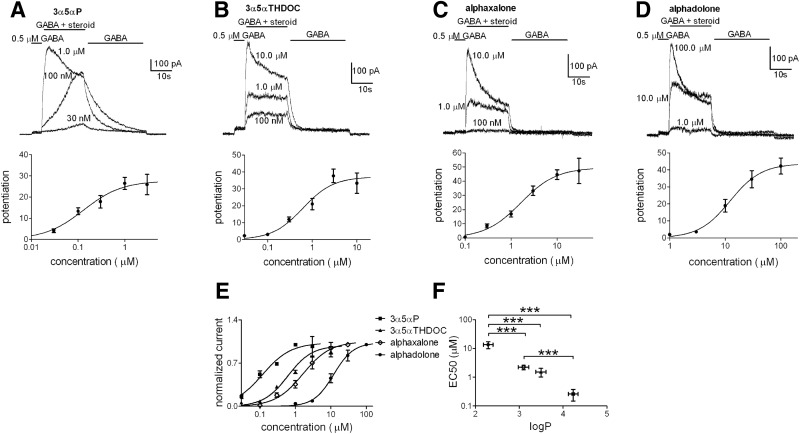
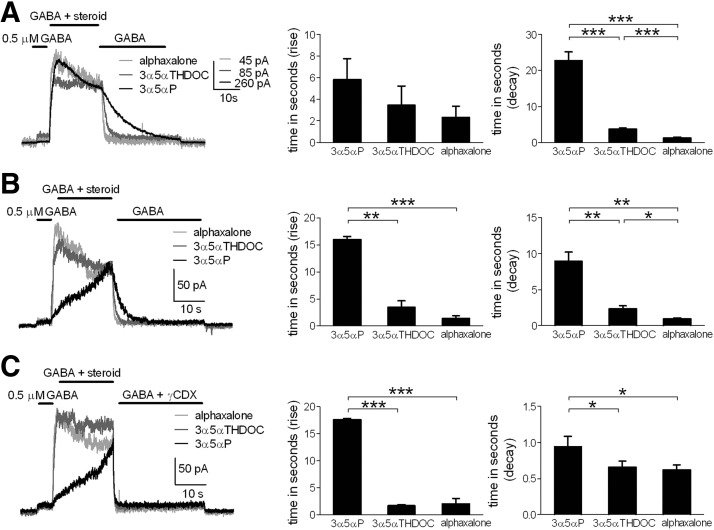
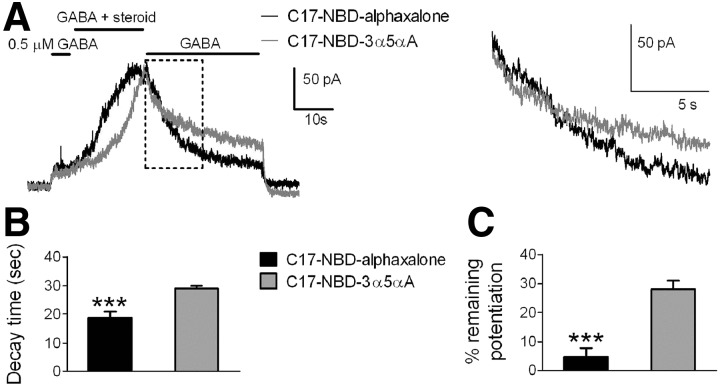
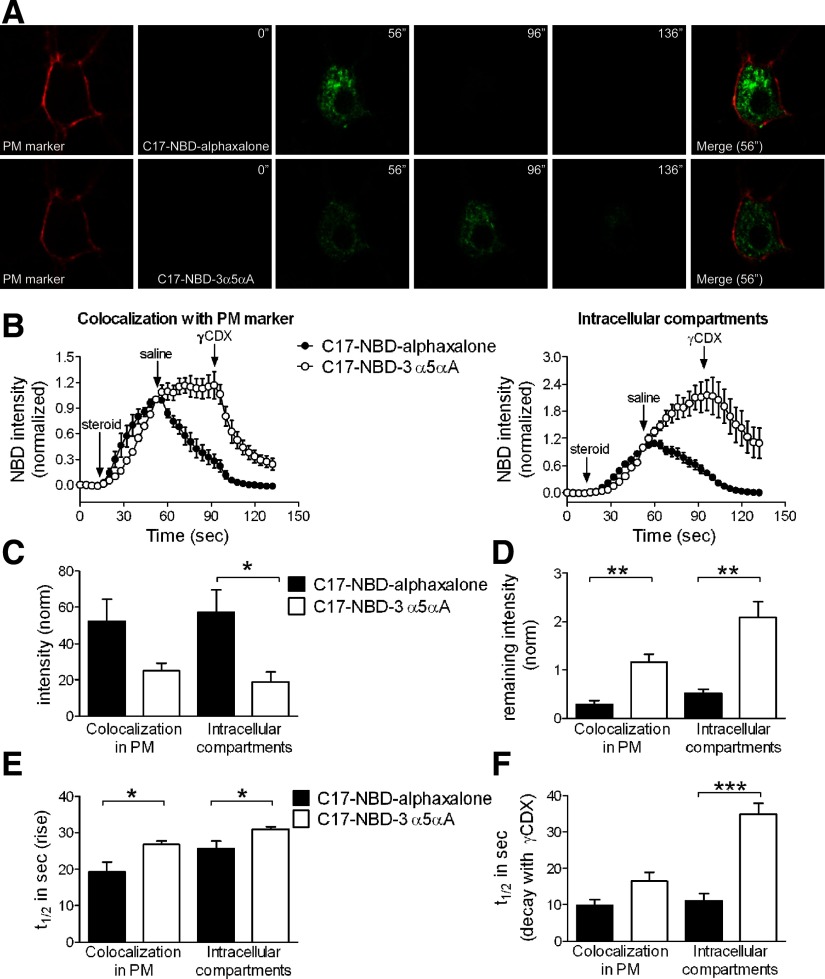
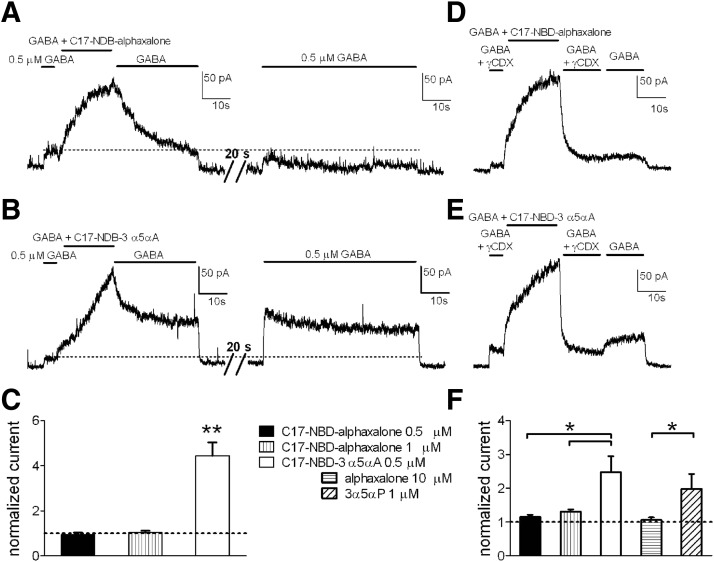
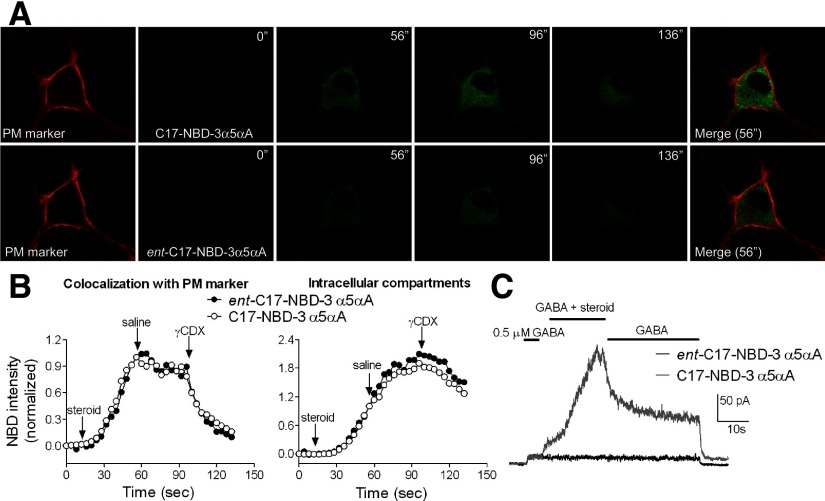
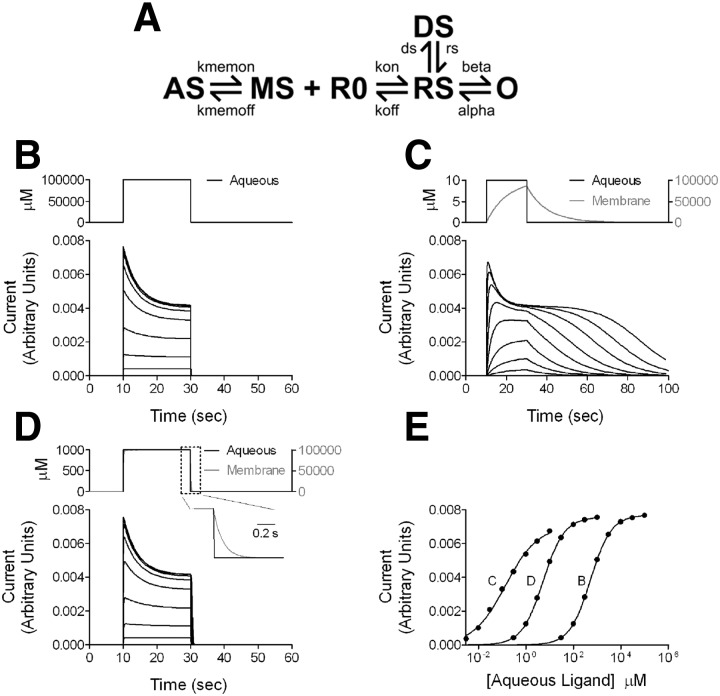
Anesthetic steroids with actions at gamma-aminobutyric acid type A receptors (GABA(A)Rs) may access transmembrane domain binding site(s) directly from the plasma cell membrane. Accordingly, the effective concentration in lipid phase and the ability of the steroid to meet pharmacophore requirements for activity will both contribute to observed steady-state potency. Furthermore, onset and offset of receptor effects may be rate limited by lipid partitioning. Here we show that several GABA-active steroids, including naturally occurring neurosteroids, of different lipophilicity differ in kinetics and potency at GABA(A)Rs. The hydrophobicity ranking predicted relative potency of GABA(A)R potentiation and predicted current offset kinetics. Kinetic offset differences among steroids were largely eliminated by gamma-cyclodextrin, a scavenger of unbound steroid, suggesting that affinity differences among the analogues are dwarfed by the contributions of nonspecific accumulation. A 7-nitrobenz-2-oxa-1,3-diazole (NBD)-tagged fluorescent analogue of the low-lipophilicity alphaxalone (C17-NBD-alphaxalone) exhibited faster nonspecific accumulation and departitioning than those of a fluorescent analogue of the high-lipophilicity (3alpha,5alpha)-3-hydroxypregnan-20-one (C17-NBD-3alpha5alphaA). These differences were paralleled by differences in potentiation of GABA(A)R function. The enantiomer of C17-NBD-3alpha5alphaA, which does not satisfy pharmacophore requirements for steroid potentiation, exhibited identical fluorescence kinetics and distribution to C17-NBD-3alpha5alphaA, but was inactive at GABA(A)Rs. Simple simulations supported our major findings, which suggest that neurosteroid binding affinity is low. Therefore both specific (e.g., fulfilling pharmacophore requirements) and nonspecific (e.g., lipid solubility) properties contribute to the potency and longevity of anesthetic steroid action.


Figures

FIG. 1.
FIG. 1.
Structures and predicted lipophilicity of natural and synthetic steroid analogues that potentiate γ-aminobutyric acid type A (GABAA) currents. A: 3α5αP; B: alphaxalone; C: 3α5αTHDOC; D: alphadolone. 3α5αP and 3α5αTHDOC are natural neurosteroids. Alphaxalone and alphadolone are synthetic analogues. E and F: synthetic neuroactive steroid analogues with a fluorescent substituent (NBD) at carbon 17, C17-NBD-3α5αA (E) and C17-NBD-alphaxalone (F). G: estimated partition coefficients (log P) for each steroid. Values were calculated using 11 different algorithms and are shown as means ± SE, *P < 0.05, ***P < 0.0001 (paired t-test). Alphadolone, (3α,5α)-3,21-dihydroxypregnane-11,20-dione; alphaxalone, (3α,5α)-3-hydroxypregnane-11,20-dione; 3α5αP, (3α,5α)-3-hydroxypregnan-20-one; 3α5αTHDOC, (3α,5α)-3,21-dihydroxypregnan-20-one; NBD, 7-nitrobenz-2-oxa-1,3-diazole.
FIG. 2.
FIG. 2.
Evaluation of steroid potentiation on GABAA receptors (GABAARs) in Xenopus laevis oocytes. Increasing concentrations of 3α5αP (A, 0.1–10 μM, n = 7), 3α5αTHDOC (B, 0.3–30 μM, n = 17), alphaxalone (C, 0.3–30 μM, n = 16), and alphadolone (D, 3–300 μM, n = 4) were applied to Xenopus laevis oocytes expressing rat α1β2γ2L GABAAR subunits. The concentration–response curves were obtained in the presence of 2 μM GABA and potentiated responses were expressed relative to the GABA response in the absence of steroid. For display purposes, the lines represent fits of the Hill equation to the averaged data points shown in the figure. Parameters from the summary fits for 3α5αP, 3α5αTHDOC, alphaxalone, and alphadolone, respectively, were EC50 (the concentration of steroid producing 50% of maximum potentiation): 0.6, 1.3, 4.6, and 45.9 μM; Hill coefficient: 1.6, 1.8, 1.5, and 2.1. E: concentration–response curves of the steroids were normalized to the individual maximum potentiation to facilitate comparison of shapes and EC50 values. F: summary EC50 values from fits to the individual oocytes. The EC50 values for each steroid are shown as a function of log P. Values are means ± SE; *P < 0.05, **P < 0.01, ***P < 0.0001 (unpaired t-test).
FIG. 3.
FIG. 3.
Evaluation of steroid potentiation on GABAARs in hippocampal neurons. Steroid potentiation traces (top panels) of increasing concentrations of 3α5αP (A, 0.03–3 μM, n = 11), 3α5αTHDOC (B, 0.03–10 μM, n = 16), alphaxalone (C, 0.1–30 μM, n = 17), and alphadolone (D, 1–100 μM, n = 4), applied to neuronal cultures. The concentration–response curves (AD, bottom panels) were obtained in the presence of 0.5 μM GABA and potentiated responses were normalized to the first GABA application (see methods). For display purposes, the lines represent fits of the Hill equation to the averaged data points shown in the figure. Parameters from the summary fits for 3α5αP, 3α5αTHDOC, alphaxalone, and alphadolone, respectively, were EC50: 0.3, 1.5, 2.2, and 13.4 μM; Hill coefficient: 1.1, 1.3, 1.1, and 1.5. E: data for each steroid were normalized to the individual maximum potentiation to facilitate potency comparisons. F: the estimated EC50 values for the steroids from fits to the individual cells are shown as a function of the corresponding log P. Values are means ± SE; ***P < 0.0001 (unpaired t-test). The comparison of 3α5αTHDOC vs. 3α5αP showed a significant difference only with a one-tailed t-test (P < 0.05).
FIG. 4.
FIG. 4.
Onset and offset kinetics of different steroid analogues in neuronal cultures. A: representative traces of steroid potentiation yielded by equimolar analogue concentration (1 μM). Compounds were coapplied with GABA (0.5 μM) after a GABA preapplication. Comparisons of 10–90% rise and decay times are shown (bar diagrams). Values are means ± SE (3α5αP, n = 5; 3α5αTHDOC, n = 6; alphaxalone, n = 7); ***P < 0.0001 (unpaired t-test). There was no statistical difference in rise time among the 3 analogues at 1 μM. B: representative traces of steroid potentiation determined by EC20 analogue concentration (0.05 μM, 3α5αP; 0.3 μM, 3α5αTHDOC; 0.85 μM, alphaxalone). Comparisons of rise and decay times are shown (bar diagrams). Values are means ± SE (n = 5); *P < 0.05, **P < 0.01, ***P < 0.0001 (paired t-test). C: representative traces of steroid potentiation determined with EC20 concentration (0.05 μM, 3α5αP; 0.3 μM, 3α5αTHDOC; 0.85 μM, alphaxalone). Potentiation removal was determined by coapplication of 500 μM γCDX with 0.5 μM GABA. Comparisons of mean rise and decay times are shown (bar diagrams). Values are means ± SE (n = 6); *P < 0.05, ***P < 0.0001 (paired t-test).
FIG. 5.
FIG. 5.
Potentiation characteristics of C17-NBD fluorescent steroid analogues. A: representative traces of fluorescent steroid potentiation (left) and expanded detail of the boxed region during wash (right) determined at equimolar concentration (0.5 μM). Drugs were coapplied with GABA (0.5 μM) on hippocampal neurons. B: bar diagrams indicate decay times of tagged steroids. Values are means ± SE (n = 13); ***P < 0.0001 (paired t-test). Analysis was performed as described in methods. Since many cells (12/13 cells) treated with C17-NBD-3α5αA failed to fall to 10% of the peak potentiation by the end of the 30-s wash, a conservative time equal to the total washing time (30 s) was assigned for purposes of averaging. In these same 13 cells, potentiation in 3/13 treated with C17-NBD-alphaxalone failed to fall to 10% and a 30-s fall time was similarly assigned. C: bar diagrams indicate remaining potentiation of fluorescent steroids after 30-s wash with 0.5 μM GABA. Values are means ± SE (n = 13); ***P < 0.0001 (paired t-test).
FIG. 6.
FIG. 6.
Imaging and analysis of C17-NBD fluorescent steroid analogues. A: hippocampal neurons were stained with a plasma membrane (PM) marker (CellMask Orange) and NBD-tagged steroids (0.5 μM) were applied for 40 s. Washes with saline and then with 500 μM γ-cyclodextrin (γCDX) lasted for 40 s (each wash). Images were acquired with 4-s interval. NBD fluorescence was always higher for C17-NBD-alphaxalone (A, 56″) and wash with saline was sufficient to remove fluorescence (A, 96″). By contrast, C17-NBD-3α5αA was difficult to remove even after 40-s wash with 500 μM γCDX (A, 136″). Merged images use the NBD-steroid images from 56″. B: fluorescence intensities of selected regions were plotted over time. Intensity values are means ± SE (n = 6). The fluorescence in each compartment was normalized to the last point of steroid application, immediately before saline wash, to emphasize time course differences. Start points of steroid applications and washes are indicated. C17-NBD-3α5αA was not removed by saline and surprisingly exhibited a fluorescence increase in the intracellular compartment during wash with saline. The increase was not as evident in perimembrane regions associated with the plasma membrane marker. CF: quantitative comparisons of C17-NBD analogues in both intracellular compartments and perimembrane regions. Values are means ± SE (n = 6). C: bar diagrams of normalized fluorescence intensities at the end of steroid application. *P < 0.05 (paired t-test). D: bar diagrams of normalized remaining fluorescence intensities after saline wash (before γCDX application). **P < 0.01 (paired t-test). E: bar diagrams of onset times using the time to reach half the intensity value measured at the end of steroid application (t1/2). *P < 0.05 (paired t-test). F: bar diagrams of offset times during wash with 500 μM γCDX using the time to reach half the intensity value measured at the end of γCDX application (t1/2). Note that the t1/2 for intracellular fluorescence elimination is artificially truncated at the limit of the 40-s wash time. ***P < 0.0001 (paired t-test).
FIG. 7.
FIG. 7.
Effects of intracellular accumulation of C17-NBD steroid analogues on GABA response potentiation in neurons. A and B: representative traces of GABA potentiation determined for 0.5 μM C17-NBD-alphaxalone (A, left) and 0.5 μM C17-NBD-3α5αA (B, left), followed by a 30-s wash in GABA alone, a 20-s wash in saline, and a reapplication of GABA alone (A and B, right) The GABA reapplication showed a larger residual current following C17-NBD-3α5αA potentiation. C: summary of effects over multiple cells treated as in A and B. Doubling the concentration of C17-NBD-alphaxalone (1 μM; middle bar) did not increase the response to a test GABA application. GABA responses to the second application are normalized to the first (original) GABA application (dotted horizontal line). Values are means ± SE (n = 10 for 0.5 μM C17-NBD-alphaxalone; n = 5 for 1 μM C17-NBD-alphaxalone; n = 11 for 0.5 μM C17-NBD-3α5αA); **P < 0.01 (unpaired t-test). D and E: representative traces of GABA potentiation by C17-NBD-alphaxalone (D) and C17-NBD-3α5αA (E) (0.5 μM), applied with GABA (0.5 μM). To speed offset of potentiation, γCDX (500 μM) was added in the GABA solution and applied for 15 s following potentiation. GABA alone was then immediately reapplied for 15 s. In cells previously exposed to C17-NBD-3α5αA, a rebound potentiation reemerged. F: summary of multiple cells treated as in D and E. Increasing C17-NBD-alphaxalone concentration to 1 μM did not increase rebound potentiation following GABA reapplication. Nonfluorescent compounds (10 μM alphaxalone and 1 μM 3α5αP) were tested with a similar protocol using a 10- to 15-s γCDX wash; a summary for rebound potentiation is shown. Rebound potentiation was normalized to the first (original) GABA application (dotted horizontal line). Values are means ± SE (n = 7 for 0.5 μM C17-NBD-alphaxalone; n = 6 for 1 μM C17-NBD-alphaxalone; n = 6 for 0.5 μM C17-NBD-3α5αA, n = 9 for 10 μM alphaxalone, n = 9 for 1 μM 3α5αP); *P < 0.05 (unpaired t-test for fluorescent compounds, paired t-test for parent steroids).
FIG. 8.
FIG. 8.
Comparison of C17-NBD-3α5αA and its enantiomer with respect to cellular accumulation and to GABA response potentiation. A: hippocampal neurons were stained with PM marker, and NBD-tagged steroids (0.5 μM) were applied for 40 s. Washes with saline and then with 500 μM γCDX lasted for 40 s (each wash). Images were acquired at 4-s intervals. Similar intracellular accumulation and elimination were observed. Although in this example, ent-C17-NBD-3α5αA exhibited somewhat weaker fluorescence than that of its natural counterpart, this was not consistent among all cells; there was no statistical difference in mean fluorescence intensities. Merged images used the NBD-steroid images from the 56″ time point. B: fluorescence intensities, normalized to the last point of steroid application, were plotted over time. Traces representative of 6 cells are shown. Start points of drugs application and washes are indicated by arrows. C: representative traces (n = 4) showing effects of C17-NBD-3α5αA and its enantiomer (0.5 μM) on GABA (0.5 μM) responses. The enantiomer pair exhibits a strong difference in GABA potentiation.
FIG. 9.
FIG. 9.
Simulations of conventional aqueous ligand access vs. membrane access to a receptor. A: kinetic scheme for the simulations. See Supplemental text and Supplemental Table S1 for details of the simulation parameters, including rationale and constraints. AS, aqueous steroid ligand; MS, membrane steroid; R0, unbound receptor; RS, ligand bound receptor; O, open channel; DS, a liganded desensitized state. Binding parameters (kon, koff) were set to simulate a low-affinity receptor. Only the open state is conducting. B: simulations of a conventional receptor responding to aqueous ligand application. In the context of the scheme shown in A, this was implemented by setting Kmem on and Kmem off to equal values, more rapid than other rate constants in the scheme. The bottom panel shows simulated current responses to a 20-s pulse of aqueous concentrations of applied agonist (concentration range, 30 μM to 100 mM). The top panel shows aqueous agonist concentration profile for the largest response. C: simulated current responses of a membrane receptor to aqueous application of agonist with a log P of 4 (aqueous concentration range, 0.03–3 μM). Membrane accumulation and departure rates were based on observations from fluorescent steroids; values are given in the Supplemental text. The concentration traces represent aqueous (black) and membrane (gray) concentrations for a 20-s pulse application of 10 μM aqueous ligand, the highest concentration simulated. Note that the asymptotic membrane concentration exceeds the aqueous concentration by 4 orders of magnitude. D: the simulation was repeated with membrane departure rate sped 100-fold relative to the simulation in C and D to simulate a ligand with log P of 2 (aqueous concentration range, 0.3–1,000 μM). Concentration traces again represent the highest concentration simulated (1,000 μM aqueous). The inset shows the boxed region and shows the difference between the time courses of aqueous and membrane concentration on aqueous ligand removal. E: concentration–response curves for peak responses from the data in BD. The letter associated with each curve represents the relevant panel letter. The solid lines represent fits to the Hill equation. For the data in B (receptor for aqueous ligand), the potency (EC50) estimate from the fit was 519.4 μM, with a Hill coefficient of 0.99. For the data in C (membrane receptor, ligand log P = 4), the EC50 from the fit was 0.14 μM, with a Hill coefficient of 0.64. For the data in D (membrane receptor, ligand log P = 2), the fit yielded an EC50 of 5.26 μM and a Hill coefficient of 0.97. Note that the dramatic shifts in EC50 were effected with no change in ligand binding or dissociation constants, kon and koff.

Similar articles

Cited by

References

    1. Adam JM, Bennett DJ, Bom A, Clark JK, Feilden H, Hutchinson EJ, Palin R, Prosser A, Rees DC, Rosair GM, Stevenson D, Tarver GJ, Zhang MQ. Cyclodextrin-derived host molecules as reversal agents for the neuromuscular blocker rocuronium bromide: synthesis and structure–activity relationships. J Med Chem 45: 1806–1816, 2002. - PubMed
    1. Agis-Balboa RC, Pinna G, Zhubi A, Maloku E, Veldic M, Costa E, Guidotti A. Characterization of brain neurons that express enzymes mediating neurosteroid biosynthesis. Proc Natl Acad Sci USA 103: 14602–14607, 2006. - PMC - PubMed
    1. Akk G, Covey DF, Evers AS, Steinbach JH, Zorumski CF, Mennerick S. Mechanisms of neurosteroid interactions with GABAA receptors. Pharmacol Ther 116: 35–57, 2007. - PMC - PubMed
    1. Akk G, Shu HJ, Wang C, Steinbach JH, Zorumski CF, Covey DF, Mennerick S. Neurosteroid access to the GABAA receptor. J Neurosci 25: 11605–11613, 2005. - PMC - PubMed
    1. Alakoskela JM, Covey DF, Kinnunen PK. Lack of enantiomeric specificity in the effects of anesthetic steroids on lipid bilayers. Biochim Biophys Acta 1768: 131–145, 2007. - PubMed

Publication types

MeSH terms

LinkOut - more resources