. 2009 Oct;81(4):768-76.
doi: 10.1095/biolreprod.109.077909. Epub 2009 Jun 24.

Evidence that a defective spindle assembly checkpoint is not the primary cause of maternal age-associated aneuploidy in mouse eggs

Affiliations

Evidence that a defective spindle assembly checkpoint is not the primary cause of maternal age-associated aneuploidy in mouse eggs

Francesca E Duncan et al. Biol Reprod. 2009 Oct.

Abstract

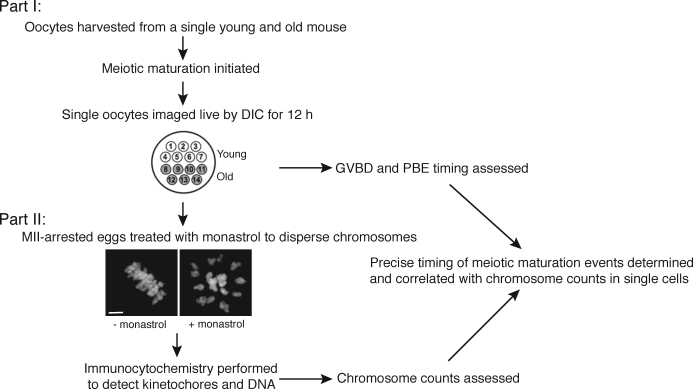
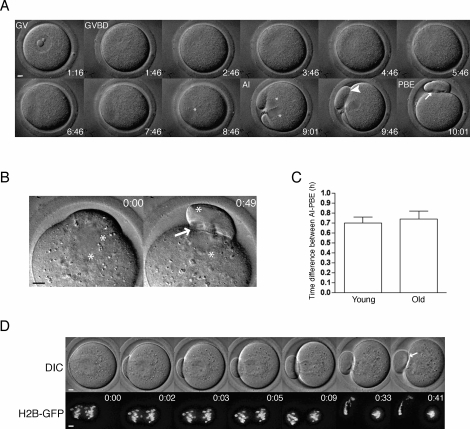
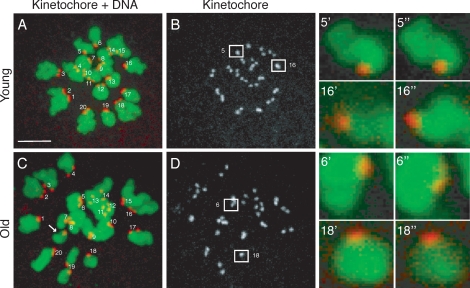
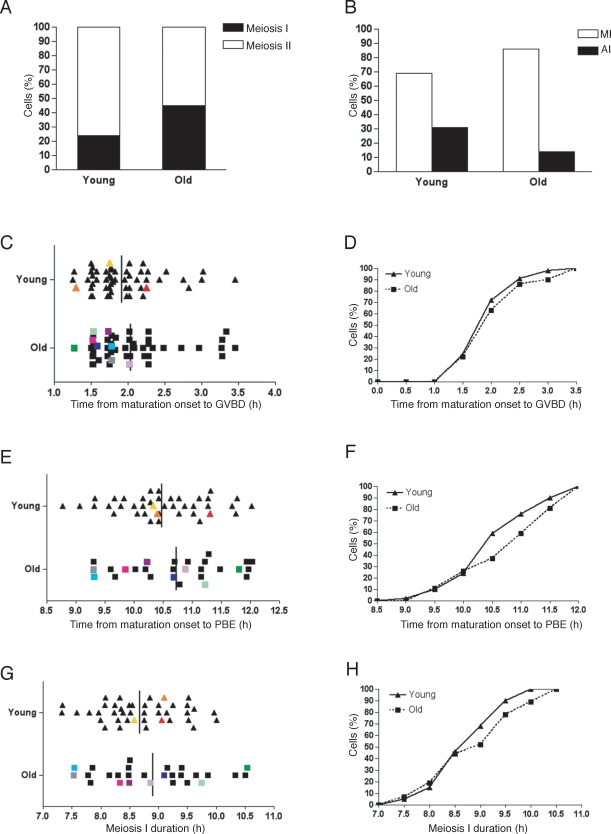
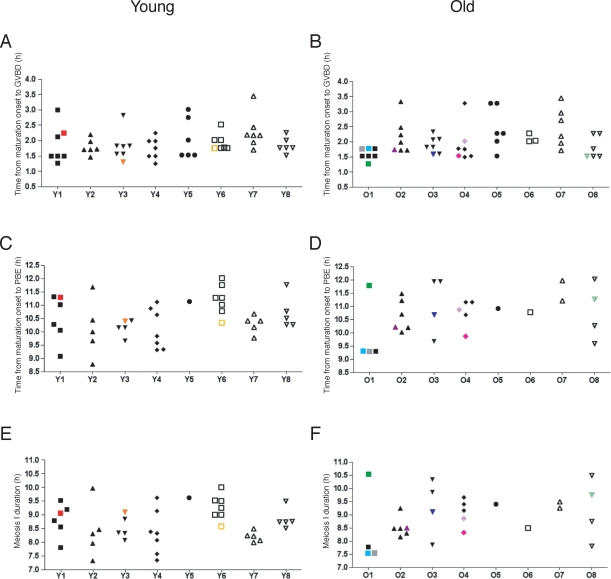
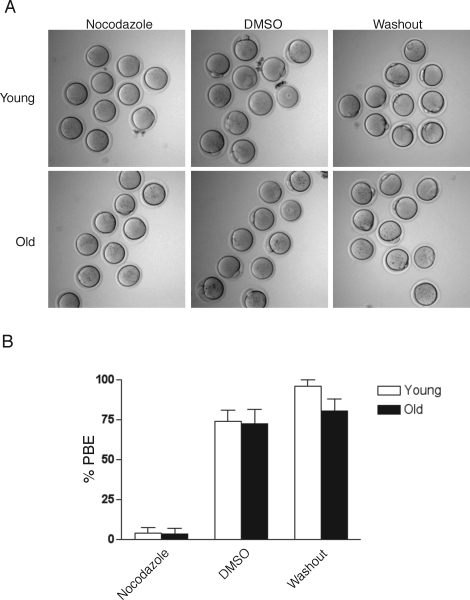
Advanced maternal age is unequivocally associated with increased aneuploidy in human eggs and infertility, but the molecular basis for this phenomenon is unknown. An age-dependent deterioration of the spindle assembly checkpoint (SAC) has been proposed as a probable cause of aneuploidy. Accurate chromosome segregation depends on correct chromosome attachment to spindle microtubules, and the SAC provides time for this process by delaying anaphase onset until all chromosomes are stably attached. If SAC function decreases with age, oocytes from reproductively old mice would enter anaphase of meiosis I (AI) prematurely, leading to chromosome segregation errors and aneuploid eggs. Although intuitively appealing, this hypothesis is largely untested. We used a natural reproductive aging mouse model to determine if a defective SAC is the primary cause of aneuploidy in eggs. We tracked the progress of individual oocytes from young and old mice through meiosis I by time-lapse microscopy and counted chromosomes in the resulting eggs. This data set allowed us to correlate the timing of AI onset with aneuploidy in individual oocytes. We found that oocytes from old mice do not enter AI prematurely compared to young counterparts despite a 4-fold increase in the incidence of aneuploidy. Moreover, we did not observe a correlation between the timing of AI onset and aneuploidy in individual oocytes. When SAC function was challenged with a low concentration of the spindle toxin nocodazole, oocytes from both young and old mice arrested at meiosis I, which is indicative of a functional checkpoint. These findings indicate that a defective SAC is unlikely the primary cause of aneuploidy associated with maternal age.


Figures

FIG. 1.
FIG. 1.
Experimental design for comparing meiotic progression and aneuploidy in individual young and old oocytes. Meiotic progression was monitored by time-lapse microscopy for 14 oocytes (seven young and seven old) in parallel (Part I). After live imaging, oocytes were cultured for 1 h in monastrol then fixed and processed for immunocytochemistry to label chromosomes and kinetochores (Part II). Chromosomes were counted to assess aneuploidy in each MII-arrested egg. The image shows that 1-h culture with monastrol effectively disperses the MII chromosomes, visualized by Sytox. Bar = 5 μm.
FIG. 2.
FIG. 2.
Tracking meiotic progression by time-lapse microscopy. A) A representative series of DIC images shows meiotic progression in an individual oocyte. B) AI was monitored in oocytes where the chromosomes were clearly visible by DIC, and a representative series is shown. C) The average time of AI onset to complete PBE in young and old oocytes was assessed by analysis of DIC images. Data are shown as mean ± SEM (n = 21 young and 15 old oocytes). The timing of AI onset and PBE were tightly coupled, and there was no statistically significant difference between young and old oocytes (unpaired t-test; P = 0.6439). D) Chromosome movement in young and old oocytes microinjected with H2b-Gfp cRNA was visualized during AI using time-lapse confocal microscopy. Upper panels show DIC images, and lower panels show H2B-GFP fluorescence. A total of 11 young and 14 old oocytes were imaged, and a set of representative images is shown. Asterisks mark the position of chromosomes in all images, the arrowhead shows incomplete cytokinesis between the egg and the PB, and the arrow highlights complete membrane separation. Time stamps (h:mm) in A label time following removal of milrinone from the culture medium and in B and D label elapsed time from AI onset as indicated by initial chromosome separation. Bar = 5 μm.
FIG. 3.
FIG. 3.
Determining chromosome number in intact eggs. A–D) To count chromosomes following live imaging, eggs were treated with monastrol, then fixed and stained for kinetochores using human CREST autoimmune antiserum (grayscale or red) and for chromosomes using Sytox (green). Representative projected images from young (A, B) and old (C, D) eggs are shown. In the merged image of kinetochores and DNA (A and C), sister kinetochore pairs are labeled from 1–20. The arrow highlights a single extra chromatid in the old egg (C), indicating hyperploidy. Boxed kinetochore pairs in B and D are magnified (right) to show distinct kinetochores at different z planes (’ and ”). The kinetochores in pairs 5’ and 5” and in 6’ and 6” are separated by 0.8 μm in the z direction; the kinetochores in pairs 16’ and 16” and in 18’ and 18” are separated by 1.2 μm. Bar = 5 μm.
FIG. 4.
FIG. 4.
Timing of meiotic maturation and incidence of aneuploidy in young and old oocytes. A) Following time-lapse microscopy to track meiotic progression in individual oocytes, DIC images were analyzed to score the percent of young and old oocytes that reached meiosis II or remained in meiosis I 12 h after milrinone removal. B) Oocytes that were still in meiosis I by 12 h were characterized as being either in MI (chromosomes aligned) or AI (chromosomes separated). CH) For each oocyte that reached MII in 12 h, the timing of GVBD (C, D) and PBE (E, F) was determined, and MII chromosomes were counted. Meiosis I duration was calculated as the time between GVBD and PBE (G, H). Data are shown for individual oocytes in C, E, and G. Each triangle corresponds to a single young oocyte and each square to an old oocyte. Each color represents a single oocyte tracked through meiotic progression that was determined to be aneuploid at MII. Vertical bars mark the average time of each meiotic maturation event, and no statistically significant differences between young and old oocytes were observed. (Unpaired t-test, P = 0.2351 for GVBD, P = 0.2238 for PBE, and P = 0.2277 for MI duration). The same data are presented as cumulative percentages in D, F, and H. A chi-square test with Yates correction demonstrated that there was no statistically significant difference at each time point between young and old oocytes (χ2 < 3.84, two-tailed P > 0.05). The data set includes eight experiments with a total of 54 young and 49 old oocytes.
FIG. 5.
FIG. 5.
Meiotic progression and aneuploidy assessed in individual mice. In another representation of the data in Figure 4, the timing of GVBD (A, B), PBE (C, D), and meiosis I duration (E, F) are shown for each oocyte. Oocytes from individual young (A, C, E) and old (B, D, F) mice are grouped and labeled Y1–Y8 (young) and O1–O8 (old). A total of 16 mice (eight young and eight old) were used for these experiments. Each color, consistent with the scheme in Figure 4, represents a single oocyte tracked through meiotic progression that was determined to be aneuploid at MII.
FIG. 6.
FIG. 6.
Response of young and old oocytes to a low concentration of nocodazole. A) Representative morphology of young (top) and old (bottom) oocytes that were matured for 13–14 h in the presence of 0.04 μg/ml nocodazole (left) or in DMSO (middle) as a control. Following maturation, nocodazole was washed out of the medium, and the oocytes were scored 4 h later for PBE (right). Note the absence of PBs in young and old oocytes treated with nocodazole compared to controls, indicating SAC activation at meiosis I. B) Percent of oocytes from young and old mice that emitted a PB after being matured for 13–14 h in nocodazole or DMSO or after 4 h following washout of nocodazole. This experiment was repeated three times, and >30 young and old oocytes were analyzed in each treatment group. Data in the graph are expressed as the mean ± SEM. There were no statistically significant differences between young and old oocytes in each of the three treatment groups (two-way ANOVA; P = 0.2733).

References

    1. Hassold T, Hunt P.To err (meiotically) is human: the genesis of human aneuploidy. Nat Rev Genet 2001; 2: 280–291.. - PubMed
    1. Pellestor F, Anahory T, Hamamah S.Effect of maternal age on the frequency of cytogenetic abnormalities in human oocytes. Cytogenet Genome Res 2005; 111: 206–212.. - PubMed
    1. Hassold T, Chiu D.Maternal age-specific rates of numerical chromosome abnormalities with special reference to trisomy. Hum Genet 1985; 70: 11–17.. - PubMed
    1. Warren W, Gorringe K.A molecular model for sporadic human aneuploidy. Trends Genet 2006; 22: 218–224.. - PubMed
    1. Jones KT.Meiosis in oocytes: predisposition to aneuploidy and its increased incidence with age. Hum Reprod Update 2008; 14: 143–158.. - PubMed

Publication types