

TLR7 stimulation in human plasmacytoid dendritic cells leads to the induction of early IFN-inducible genes in the absence of type I IFN
- PMID: 19553637
- PMCID: PMC2847942
- DOI: 10.1182/blood-2009-04-216770
TLR7 stimulation in human plasmacytoid dendritic cells leads to the induction of early IFN-inducible genes in the absence of type I IFN
Abstract
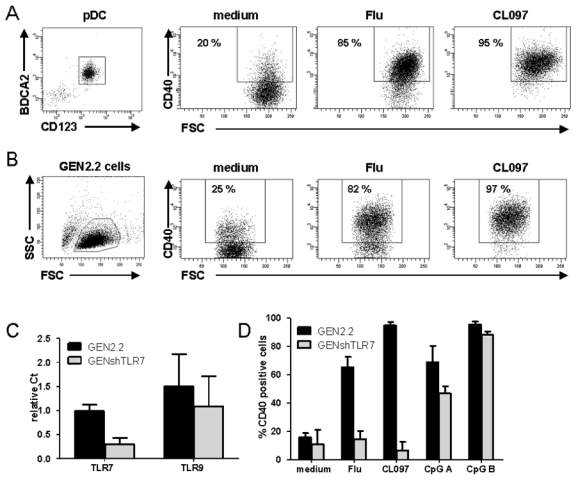
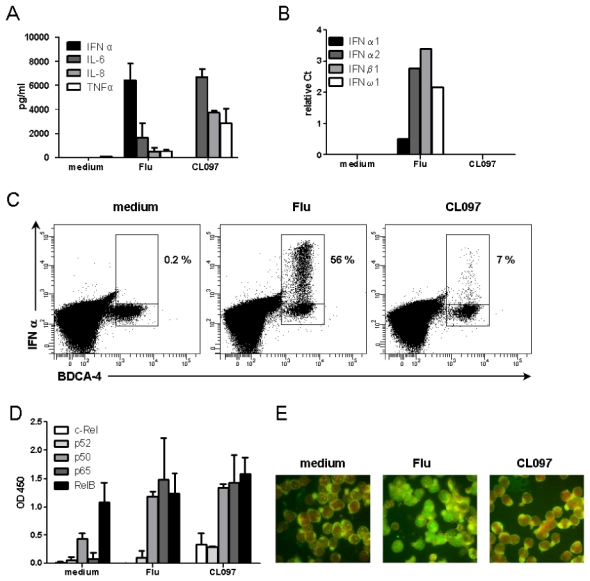
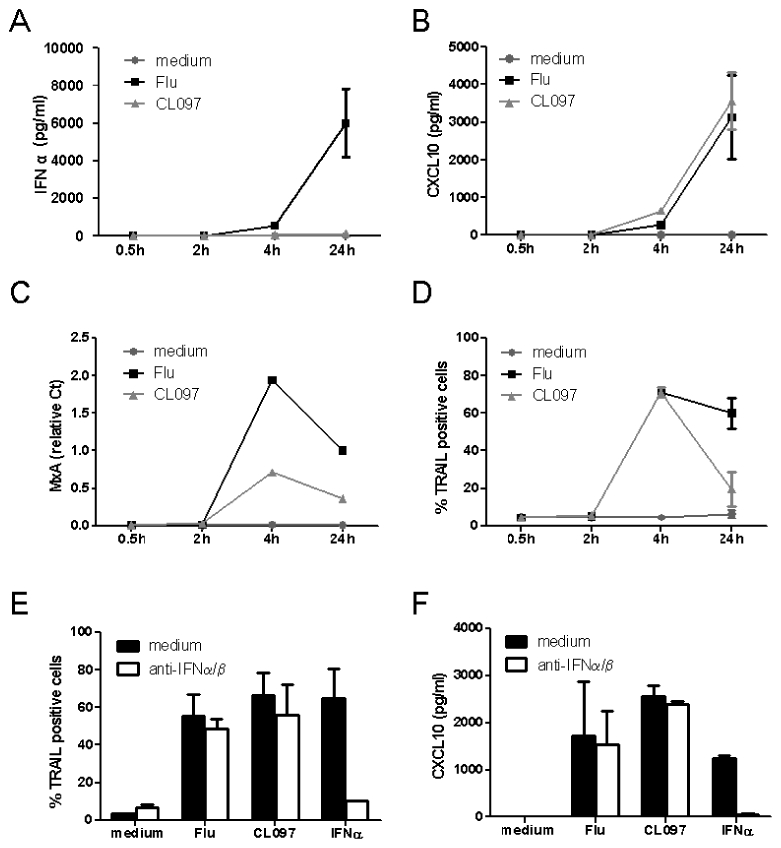
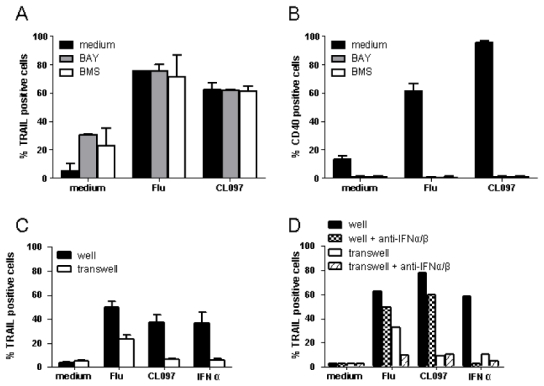
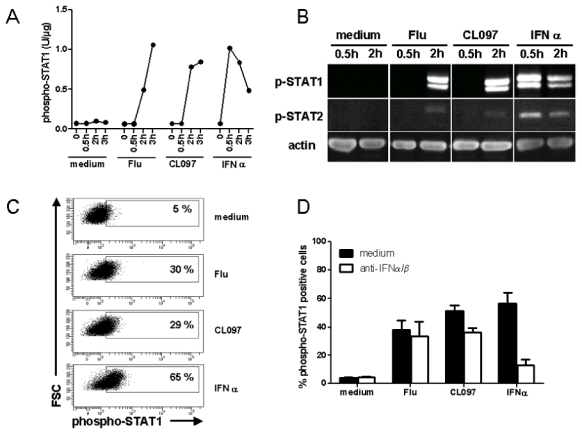
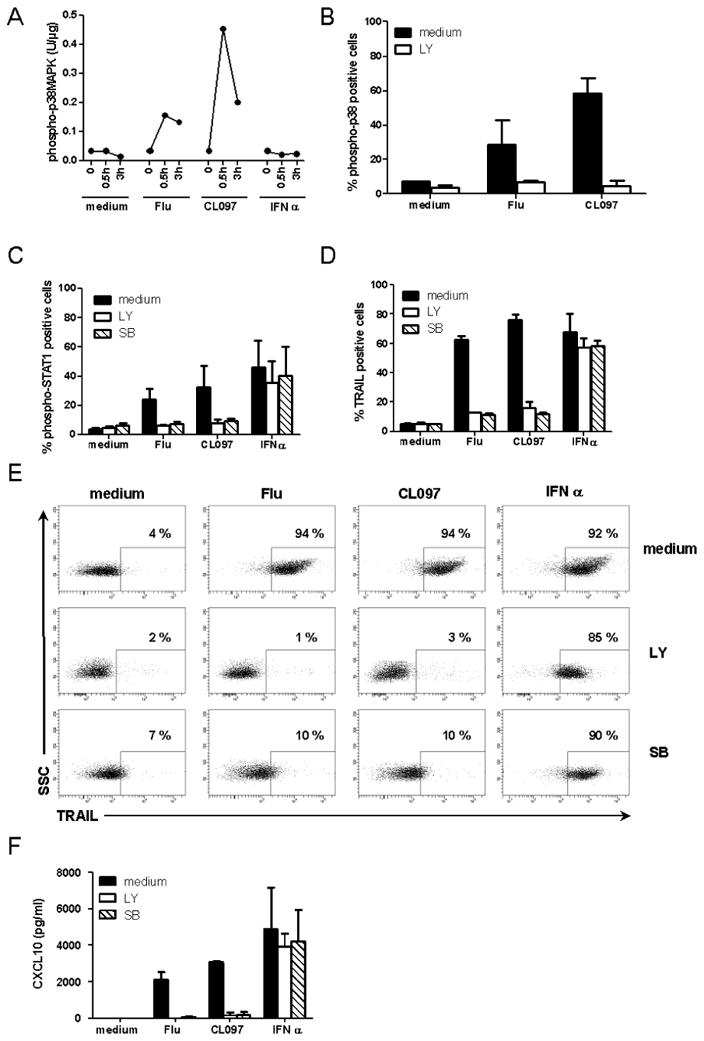
On recognition of influenza virus (Flu) by TLR7, plasmacytoid dendritic cells (pDCs) produce type I IFN in significant amounts. Synthetic TLR7 ligands induce the maturation of pDCs, as evidenced by the expression of costimulatory molecules and the production of proinflammatory cytokines; however, they induce only low-level production of IFN-alpha. To dissect the TLR7 signaling in pDCs and how these different profiles are induced, we studied the effects of 2 TLR7 ligands (Flu and CL097) on the activation of blood-isolated pDCs and the human GEN2.2 pDC cell line. Type I IFN production by pDCs correlates with differential interferon regulatory factor 7 (IRF7) translocation into the nucleus induced by the 2 TLR7 ligands. Surprisingly, with both activators we nevertheless observed the rapid expression of the IFN-inducible genes mxa, cxcl10, and trail within 4 hours of stimulation. This expression, controlled by STAT1 phosphorylation, was independent of type I IFN. STAT1 activation was found to be strictly dependent on the PI3K-p38MAPK pathway, showing a new signaling pathway leading to rapid expression of IFN-inducible genes after TLR7 triggering. Thus, pDCs, through this unusual TLR7 signaling, have the capacity to promptly respond to viral infection during the early phases of the innate immune response.
Conflict of interest statement
Conflict-of-interest disclosure: The authors declare no conflicting financial interests.
Figures
Similar articles
-
Inhibitor of IkappaB kinase activity, BAY 11-7082, interferes with interferon regulatory factor 7 nuclear translocation and type I interferon production by plasmacytoid dendritic cells.Arthritis Res Ther. 2010;12(3):R87. doi: 10.1186/ar3014. Epub 2010 May 14. Arthritis Res Ther. 2010. PMID: 20470398 Free PMC article.
-
The MEK1/2-ERK Pathway Inhibits Type I IFN Production in Plasmacytoid Dendritic Cells.Front Immunol. 2018 Feb 26;9:364. doi: 10.3389/fimmu.2018.00364. eCollection 2018. Front Immunol. 2018. PMID: 29535732 Free PMC article.
-
CD300a/c regulate type I interferon and TNF-alpha secretion by human plasmacytoid dendritic cells stimulated with TLR7 and TLR9 ligands.Blood. 2008 Aug 15;112(4):1184-94. doi: 10.1182/blood-2007-12-127951. Epub 2008 Jun 5. Blood. 2008. PMID: 18535206
-
Sex Differences in Primary HIV Infection: Revisiting the Role of TLR7-Driven Type 1 IFN Production by Plasmacytoid Dendritic Cells in Women.Front Immunol. 2021 Aug 27;12:729233. doi: 10.3389/fimmu.2021.729233. eCollection 2021. Front Immunol. 2021. PMID: 34512664 Free PMC article. Review.
-
Regulation of TLR7/9 signaling in plasmacytoid dendritic cells.Protein Cell. 2013 Jan;4(1):40-52. doi: 10.1007/s13238-012-2104-8. Epub 2012 Nov 7. Protein Cell. 2013. PMID: 23132256 Free PMC article. Review.
Cited by
-
Toll-Like Receptor 7-Targeted Therapy in Respiratory Disease.Transfus Med Hemother. 2016 Mar;43(2):114-9. doi: 10.1159/000445324. Epub 2016 Mar 22. Transfus Med Hemother. 2016. PMID: 27226793 Free PMC article. Review.
-
Endosomal trafficking inhibitor EGA can control TLR7-mediated IFNα expression by human plasmacytoid dendritic cells.Front Immunol. 2023 Nov 24;14:1202197. doi: 10.3389/fimmu.2023.1202197. eCollection 2023. Front Immunol. 2023. PMID: 38077311 Free PMC article.
-
Inability of plasmacytoid dendritic cells to directly lyse HIV-infected autologous CD4+ T cells despite induction of tumor necrosis factor-related apoptosis-inducing ligand.J Virol. 2010 Mar;84(6):2762-73. doi: 10.1128/JVI.01350-09. Epub 2009 Dec 30. J Virol. 2010. PMID: 20042498 Free PMC article.
-
A novel cancer vaccine strategy based on HLA-A*0201 matched allogeneic plasmacytoid dendritic cells.PLoS One. 2010 May 4;5(5):e10458. doi: 10.1371/journal.pone.0010458. PLoS One. 2010. PMID: 20454561 Free PMC article.
-
Direct, interferon-independent activation of the CXCL10 promoter by NF-κB and interferon regulatory factor 3 during hepatitis C virus infection.J Virol. 2014 Feb;88(3):1582-90. doi: 10.1128/JVI.02007-13. Epub 2013 Nov 20. J Virol. 2014. PMID: 24257594 Free PMC article.
References
-
- Akira S, Takeda K. Toll-like receptor signalling. Nat Rev Immunol. 2004;4:499–511. - PubMed
-
- Ito T, Wang YH, Liu YJ. Plasmacytoid dendritic cell precursors/type I interferon-producing cells sense viral infection by Toll-like receptor (TLR) 7 and TLR9. Springer Semin Immunopathol. 2005;26:221–229. - PubMed
-
- Gibson SJ, Lindh JM, Riter TR, et al. Plasmacytoid dendritic cells produce cytokines and mature in response to the TLR7 agonists, imiquimod and resiquimod. Cell Immunol. 2002;218:74–86. - PubMed
-
- Fonteneau JF, Gilliet M, Larsson M, et al. Activation of influenza virus-specific CD4+ and CD8+ T cells: a new role for plasmacytoid dendritic cells in adaptive immunity. Blood. 2003;101:3520–3526. - PubMed
Publication types
MeSH terms
Substances
LinkOut - more resources
Full Text Sources
Other Literature Sources
Research Materials
Miscellaneous
