

Regulation of Na,K-ATPase subunit abundance by translational repression
- PMID: 19553675
- PMCID: PMC2755698
- DOI: 10.1074/jbc.M109.030536
Regulation of Na,K-ATPase subunit abundance by translational repression
Abstract
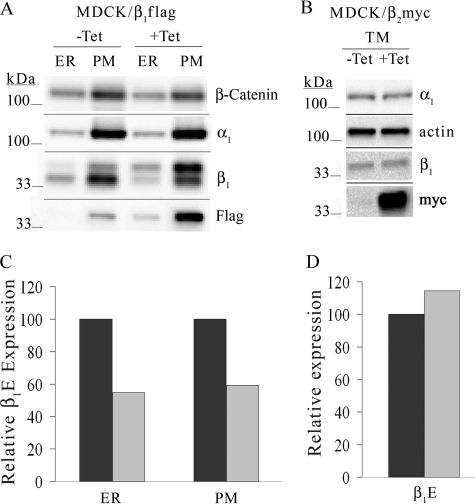
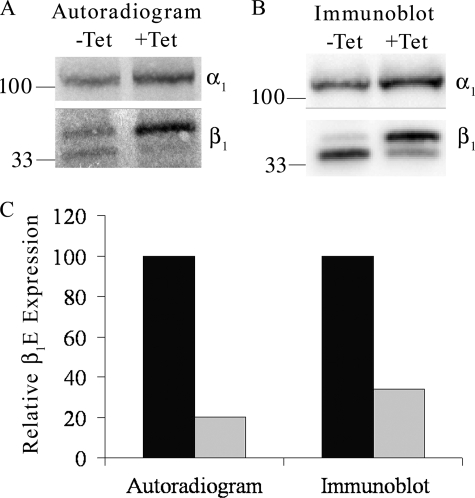
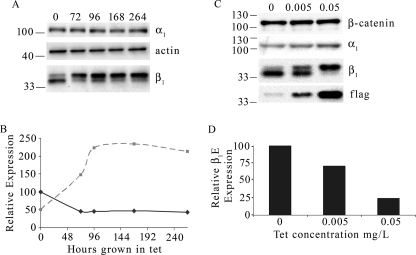
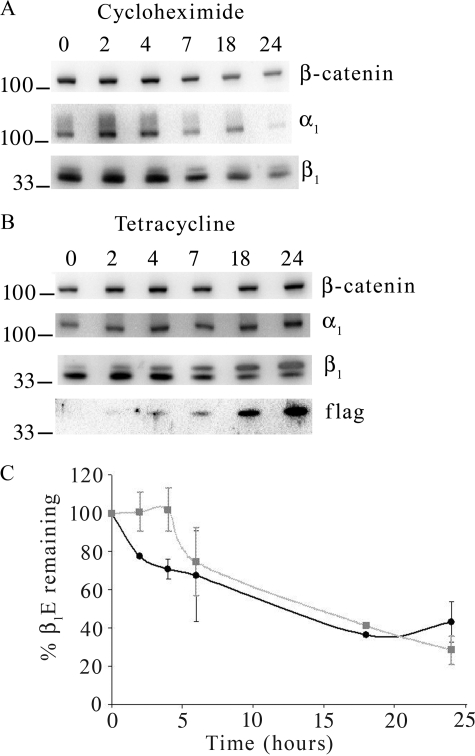
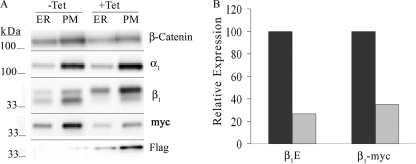
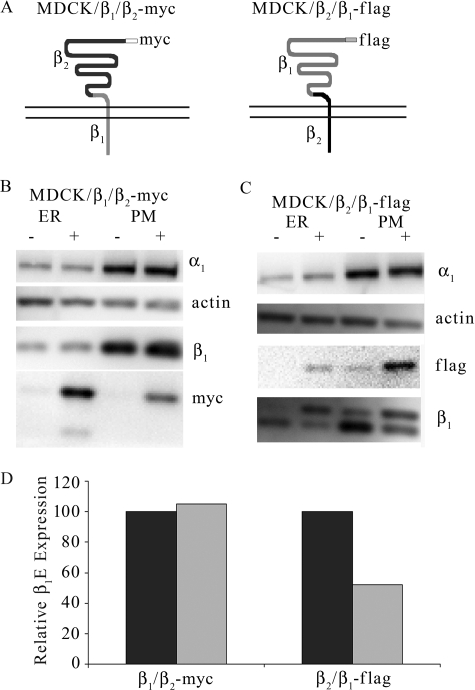
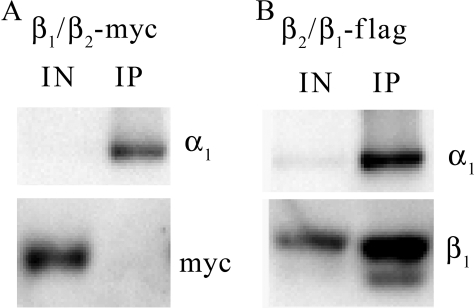
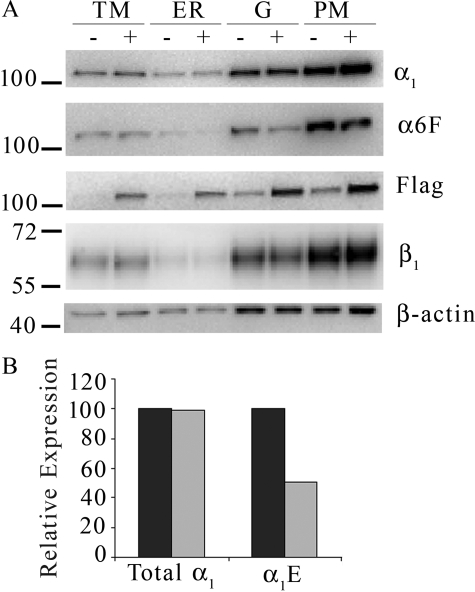
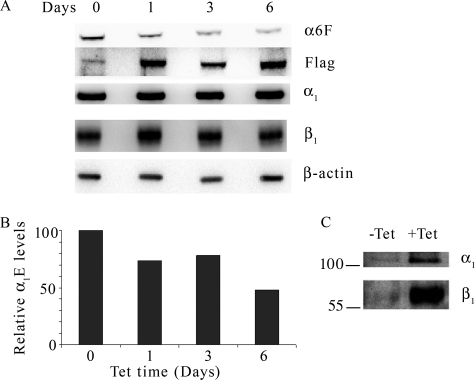
The Na,K-ATPase is an alphabeta heterodimer responsible for maintaining fluid and electrolyte homeostasis in mammalian cells. We engineered Madin-Darby canine kidney cell lines expressing alpha(1)FLAG, beta(1)FLAG, or beta(2)MYC subunits via a tetracycline-regulated promoter and a line expressing both stable beta(1)MYC and tetracycline-regulated beta(1)FLAG to examine regulatory mechanisms of sodium pump subunit expression. When overexpression of exogenous beta(1)FLAG increased total beta subunit levels by >200% without changes in alpha subunit abundance, endogenous beta(1) subunit (beta(1)E) abundance decreased. beta(1)E down-regulation did not occur during beta(2)MYC overexpression, indicating isoform specificity of the repression mechanism. Measurements of RNA stability and content indicated that decreased beta subunit expression was not accompanied by any change in mRNA levels. In addition, the degradation rate of beta subunits was not altered by beta(1)FLAG overexpression. Cells stably expressing beta(1)MYC, when induced to express beta(1)FLAG subunits, showed reduced beta(1)MYC and beta(1)E subunit abundance, indicating that these effects occur via the coding sequences of the down-regulated polypeptides. In a similar way, Madin-Darby canine kidney cells overexpressing exogenous alpha(1)FLAG subunits exhibited a reduction of endogenous alpha(1) subunits (alpha(1)E) with no change in alpha mRNA levels or beta subunits. The reduction in alpha(1)E compensated for alpha(1)FLAG subunit expression, resulting in unchanged total alpha subunit abundance. Thus, regulation of alpha subunit expression maintained its native level, whereas beta subunit was not as tightly regulated and its abundance could increase substantially over native levels. These effects also occurred in human embryonic kidney cells. These data are the first indication that cellular sodium pump subunit abundance is modulated by translational repression. This mechanism represents a novel, potentially important mechanism for regulation of Na,K-ATPase expression.
Figures
Similar articles
-
Na,K-ATPase Expression Can Be Limited Post-Transcriptionally: A Test of the Role of the Beta Subunit, and a Review of Evidence.Int J Mol Sci. 2024 Jul 6;25(13):7414. doi: 10.3390/ijms25137414. Int J Mol Sci. 2024. PMID: 39000521 Free PMC article. Review.
-
beta-Subunit overexpression alters the stoicheometry of assembled Na-K-ATPase subunits in MDCK cells.Am J Physiol Renal Physiol. 2008 Nov;295(5):F1314-23. doi: 10.1152/ajprenal.90406.2008. Epub 2008 Aug 13. Am J Physiol Renal Physiol. 2008. PMID: 18701620 Free PMC article.
-
Selective basolateral localization of overexpressed Na-K-ATPase beta1- and beta2- subunits is disrupted by butryate treatment of MDCK cells.Am J Physiol Renal Physiol. 2007 Jun;292(6):F1718-25. doi: 10.1152/ajprenal.00360.2006. Epub 2007 Mar 6. Am J Physiol Renal Physiol. 2007. PMID: 17344187
-
Translational regulation of Na,K-ATPase alpha1 and beta1 polypeptide expression in epithelial cells.J Biol Chem. 1996 Sep 20;271(38):23211-21. doi: 10.1074/jbc.271.38.23211. J Biol Chem. 1996. PMID: 8798517
-
Aspects of gene structure and functional regulation of the isozymes of Na,K-ATPase.Cell Mol Biol (Noisy-le-grand). 2001 Mar;47(2):231-8. Cell Mol Biol (Noisy-le-grand). 2001. PMID: 11354995 Review.
Cited by
-
Misfolding, altered membrane distributions, and the unfolded protein response contribute to pathogenicity differences in Na,K-ATPase ATP1A3 mutations.J Biol Chem. 2021 Jan-Jun;296:100019. doi: 10.1074/jbc.RA120.015271. Epub 2020 Nov 22. J Biol Chem. 2021. PMID: 33144327 Free PMC article.
-
Overexpression of the Na+/K+ ATPase α2 but not α1 isoform attenuates pathological cardiac hypertrophy and remodeling.Circ Res. 2014 Jan 17;114(2):249-256. doi: 10.1161/CIRCRESAHA.114.302293. Epub 2013 Nov 11. Circ Res. 2014. PMID: 24218169 Free PMC article.
-
Factors in the disease severity of ATP1A3 mutations: Impairment, misfolding, and allele competition.Neurobiol Dis. 2019 Dec;132:104577. doi: 10.1016/j.nbd.2019.104577. Epub 2019 Aug 16. Neurobiol Dis. 2019. PMID: 31425744 Free PMC article.
-
Na,K-ATPase Expression Can Be Limited Post-Transcriptionally: A Test of the Role of the Beta Subunit, and a Review of Evidence.Int J Mol Sci. 2024 Jul 6;25(13):7414. doi: 10.3390/ijms25137414. Int J Mol Sci. 2024. PMID: 39000521 Free PMC article. Review.
-
The Na+, K+-ATPase β1 subunit regulates epithelial tight junctions via MRCKα.JCI Insight. 2021 Feb 22;6(4):e134881. doi: 10.1172/jci.insight.134881. JCI Insight. 2021. PMID: 33507884 Free PMC article.
References
-
- Kaplan J. H. (2002) Annu. Rev. Biochem. 71,511–535 - PubMed
-
- Therien A. G., Blostein R. (2000) Am. J. Physiol. Cell Physiol. 279,C541–C566 - PubMed
-
- Sweadner K. J. (1979) J. Biol. Chem. 254,6060–6067 - PubMed
-
- Blanco G., Mercer R. W. (1998) Am. J. Physiol. Renal Physiol. 275,F633–F650 - PubMed
-
- Hu Y. K., Kaplan J. H. (2000) J. Biol. Chem. 275,19185–19191 - PubMed
Publication types
MeSH terms
Substances
Grants and funding
LinkOut - more resources
Full Text Sources
Other Literature Sources
