. 2009 Jun 25;459(7250):1085-90.
doi: 10.1038/nature08109.

GOLPH3 modulates mTOR signalling and rapamycin sensitivity in cancer

Affiliations

GOLPH3 modulates mTOR signalling and rapamycin sensitivity in cancer

Kenneth L Scott et al. Nature. .

Abstract

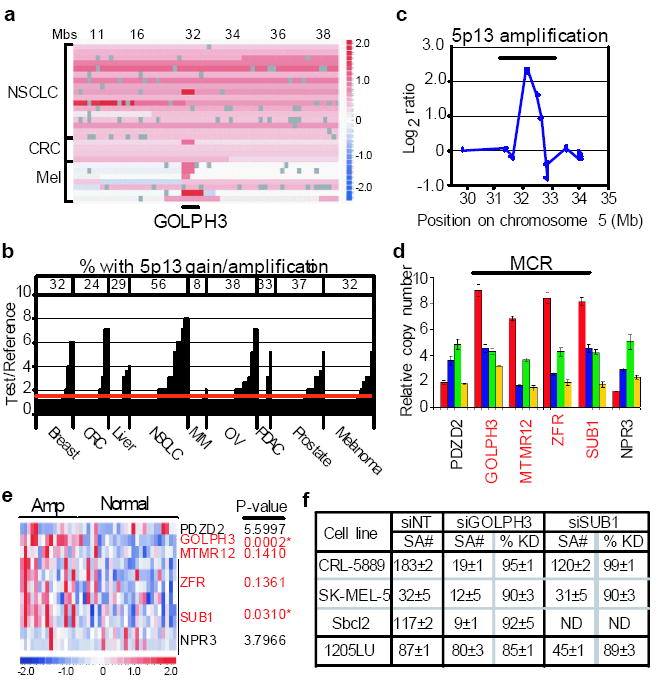
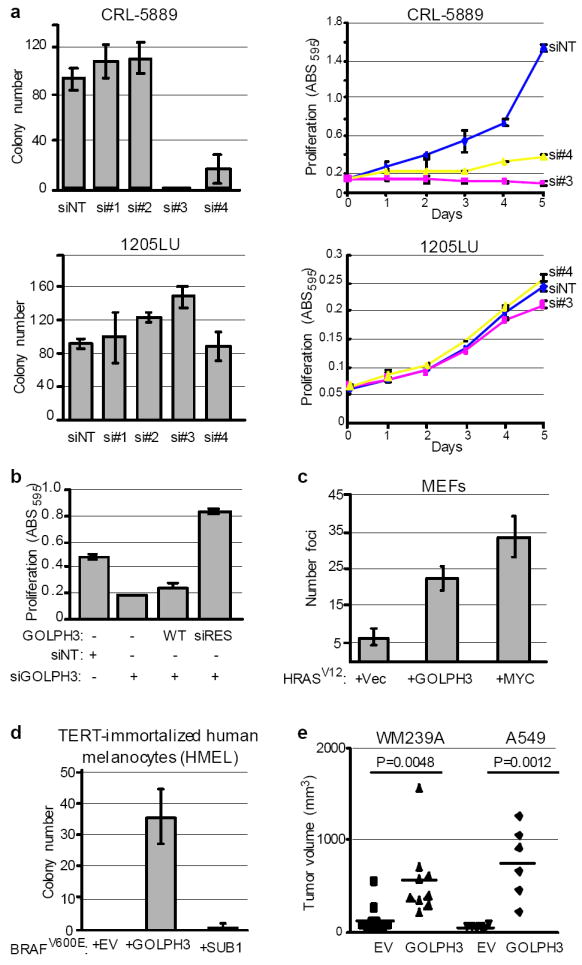
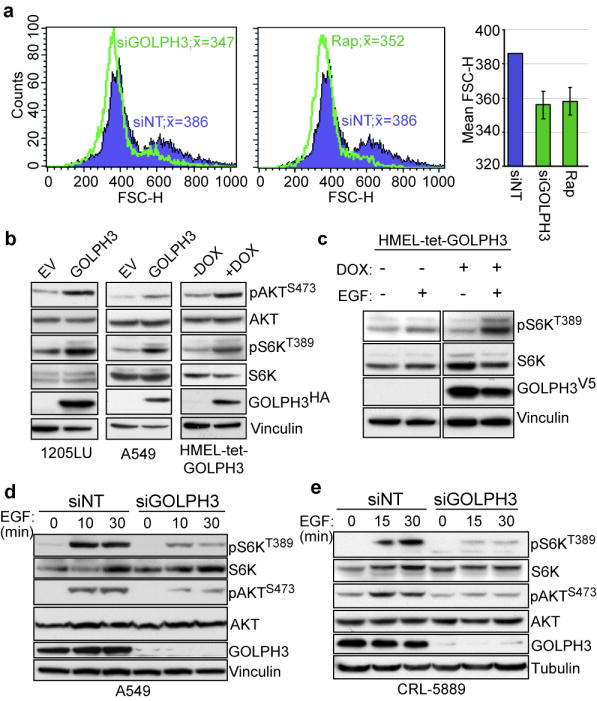
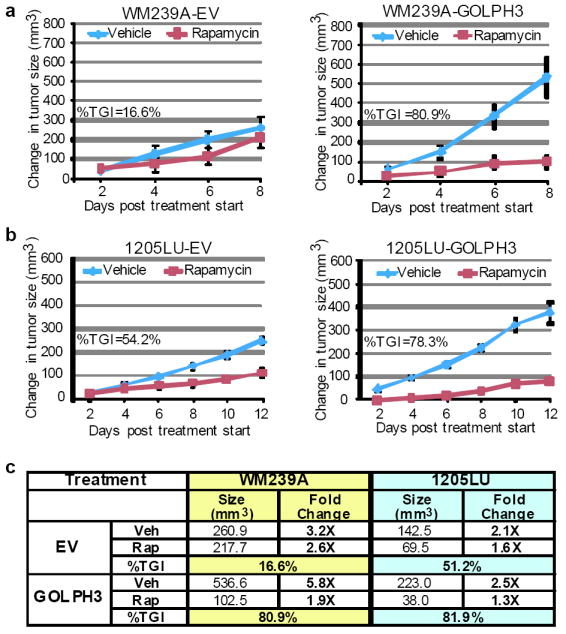
Genome-wide copy number analyses of human cancers identified a frequent 5p13 amplification in several solid tumour types, including lung (56%), ovarian (38%), breast (32%), prostate (37%) and melanoma (32%). Here, using integrative analysis of a genomic profile of the region, we identify a Golgi protein, GOLPH3, as a candidate targeted for amplification. Gain- and loss-of-function studies in vitro and in vivo validated GOLPH3 as a potent oncogene. Physically, GOLPH3 localizes to the trans-Golgi network and interacts with components of the retromer complex, which in yeast has been linked to target of rapamycin (TOR) signalling. Mechanistically, GOLPH3 regulates cell size, enhances growth-factor-induced mTOR (also known as FRAP1) signalling in human cancer cells, and alters the response to an mTOR inhibitor in vivo. Thus, genomic and genetic, biological, functional and biochemical data in yeast and humans establishes GOLPH3 as a new oncogene that is commonly targeted for amplification in human cancer, and is capable of modulating the response to rapamycin, a cancer drug in clinical use.


Figures

Figure 1
Figure 1. Genomic characterization of 5p13 amplification
a, Array-CGH heat map detailing GOLPH3 amplification at 5p13 in representative tumor specimens and cell lines from malignant melanoma (Mel), colon adenocarcinoma (CRC) and non-small cell lung cancer (NSCLC). Regions of genomic amplification and deletion are denoted in red and blue, respectively. Mbs=position on chromosome 5 in megabases. b, Histogram summary of copy number status at 5p13 by TMA-FISH analysis of 307 tumor cores of the indicated tumor types. CRC = colon adenocarcinoma; NSCLC = small cell lung cancer; MM = multiple myeloma; OV = ovarian carcinoma; PDAC = pancreatic ductal adenocarcinoma. For details see Supp Table S1. c, Minimum common region of the 5p13 amplicon defined by array-CGH from one representative tumor (melanoma C27) with focal amplification. d, Delimitation of chromosome 5p13 amplicon boundaries by genomic qPCR using four informative cell line and tumor specimens. For details see Supp Information. e, Heat map depiction of Affymetrix expression data for NSCLC 5p13 amplified (AMP) and normal specimens. * = significant correlation after bonferroni correction for multiple testing. f, Summary of soft agar colony counts (SA#) and corresponding siRNA knockdown (%KD) of GOLPH3 and SUB1 in the indicated cell lines with amplified (AMP) or normal (NL) GOLPH3 copy number. ND = not determined.
Figure 2
Figure 2. Functional validation of GOLPH3
a, The indicated cell lines were treated with non-targeting siRNA (siNT) or individual siRNAs against GOLPH3 (si#1-si#4) to assay for effect on anchorage-independent growth in soft agar (left panels) and cell proliferation (right panels). Bars indicate ±S.D. b, A549 parental cells and those expressing either wild type (WT) or siRNA resistant GOLPH3 (siRES) were treated with either non-targeting siRNA (siNT) or siRNA against GOLPH3 (siGOLPH3) and assessed for effect on cell proliferation. Bars indicate ±S.D. Shown are endpoint values for day 5. c, Primary Ink4a/Arf-deficient MEFs were transfected with the indicated vectors expressing HRASV12, MYC and GOLPH3. Vec = LacZ vector control; bars indicate ±S.D.; Two-tailed t-test: HRASV12 + GOLPH3 vs. HRASV12 + Vec, p=0.0018. d, TERT-immortalized human melanocytes (HMEL) expressing activated BRAFV600E were transduced with either GOLPH3 or SUB1 to assay for effect on anchorage-independent growth in soft agar. Bars indicate ±S.D.; Two-tailed t-test for colony number: EV vs. GOLPH3, p=0.0020; EV vs. SUB1, p=0.3739. e, The indicated cell lines were transduced with GOLPH3 to assay for effect on growth of mouse xenograft tumors.
Figure 3
Figure 3. GOLPH3 interacts with VPS35 and influences cell size
a, (top two panels) 1205LU melanoma cells stably-expressing GOLPH3 were co-immunostained for HA (GOLPH3HA; green) and TGN46 (Golgi marker; red). (Bottom panel) A549 cells were co-immunostained for GOLPH3 (green) and TGN46 (Golgi marker; red). DNA was labeled with DAPI. Arrows indicate GOLPH3 positive endosome-like structures. b, The indicated constructs were transiently expressed in 293T cells and proteins were immunoprecipitated (IP) with anti-HA (left panel) or anti-V5 (right panel) for immunoblotting with the indicated antibodies. NS = non-specific band. c, A549 cells were co-immunostained for GOLPH3 (green) and VPS35 (red). DNA was labeled with DAPI (blue). Arrows indicate GOLPH3 positive co-staining at endosome structures. d, Automated Quantitative Analysis (AQUA®) of phospho-S6KThr389 (red) in two representative lung adenocarcinomas. Cytokeratin (green) defines tumor and non-nuclear compartments. FISH ratio = 5p13:reference ratio as determined by FISH on consecutive TMA sections. Magnification = 20x.
Figure 4
Figure 4. GOLPH3 modulates phosphorylation status of mTOR substrates
a, Representative flow histograms for A549 cells were treated with non-targeting (siNT, blue), siRNA against GOLPH3 (siGOLPH3, left panel, green) or rapamycin (Rap, middle panel, green). Peak FSC-H indicated in histograms. (Right panel) Mean FSC-H for multiple experiments (n=3); Bars indicate ±S.D. b, Protein lysates extracted from 1205LU (left panel), A549 (middle panel) and HMEL-tet-GOLPH3 (right panel; with or without doxycycline (DOX)) cells expressing GOLPH3 were immunoblotted with the indicated antibodies. c, HMEL-tet-GOLPH3 cells were serum depleted and propagated with or without doxycycline (DOX), followed by treatment with or without EGF for 30 min for immunoblot analysis with the indicated antibodies. d, A549 and e, CRL-5889 cells were serum depleted and treated with either non-targeting (siNT) or siRNA against GOLPH3 (siGOLPH3), followed by growth factor stimulation with EGF for immunoblot analysis with the indicated antibodies.
Figure 5
Figure 5. The in vivo GOLPH3 growth advantage is abrogated by treatment with rapamycin
a, b Mice harboring tumors of the melanoma cell lines a, WM239A and b, 1205LU transduced with empty vector (EV; left panels) or GOLPH3 (right panels) were treated with vehicle or rapamycin (6.0 mg/kg) at two-day increments following treatment onset (tumor baseline volume ~100 mm3). Growth curves plotted as mean change in tumor volume relative to baseline starting volume for each group. Bars indicate ±S.E.M. for biological replicates. %TGI = percent tumor growth inhibition at time course endpoint. c, Table summarizing data from the rapamycin treatment xenograft studies in Fig. 5a at the same time point (day 8, post 4 doses). Veh=vehicle; Rap=rapamycin; %TGI = percent tumor growth inhibition. Note 1205LU-GOLPH3 tumors treated with vehicle grew 2.5X in size during the 8 days of treatment. In comparison, WM239A-GOLPH3 tumors grew 5.8X in size during the same period of 8 days. The %TGI in these two cohorts of tumors was similar, at 81.9% and 80.9% respectively, indicating that growth rate did not impact on the response to rapamycin.

References

    1. Manning BD, Cantley LC. AKT/PKB signaling: navigating downstream. Cell. 2007;129(7):1261–1274. - PMC - PubMed
    1. Wullschleger S, Loewith R, Hall MN. TOR signaling in growth and metabolism. Cell. 2006;124(3):471–484. - PubMed
    1. Shima H, et al. Disruption of the p70(s6k)/p85(s6k) gene reveals a small mouse phenotype and a new functional S6 kinase. Embo J. 1998;17(22):6649–6659. - PMC - PubMed
    1. Montagne J, et al. Drosophila S6 kinase: a regulator of cell size. Science. 1999;285(5436):2126–2129. - PubMed
    1. Oldham S, Montagne J, Radimerski T, Thomas G, Hafen E. Genetic and biochemical characterization of dTOR, the Drosophila homolog of the target of rapamycin. Genes Dev. 2000;14(21):2689–2694. - PMC - PubMed

Publication types

MeSH terms